 Back in 2013 I posted information about food insecurity. Food insecurity refers to the USDA's measure of the lack of
access, at times, to enough food for an active, healthy life for all household
members and limited or uncertain availability of nutritionally adequate foods.
Food insecure households are not necessarily food insecure all the time. Food
insecurity may reflect a household’s need to make trade-offs between important
basic needs, such as housing or medical bills, and purchasing nutritionally
adequate foods.
Back in 2013 I posted information about food insecurity. Food insecurity refers to the USDA's measure of the lack of
access, at times, to enough food for an active, healthy life for all household
members and limited or uncertain availability of nutritionally adequate foods.
Food insecure households are not necessarily food insecure all the time. Food
insecurity may reflect a household’s need to make trade-offs between important
basic needs, such as housing or medical bills, and purchasing nutritionally
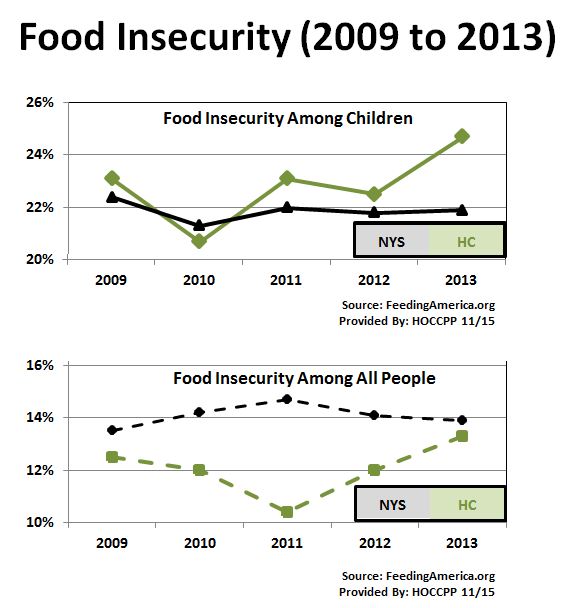
adequate foods.Since that post there is more information available from Feeding America that shows how the counties in the country have changed since 2009 through 2013. The food insecurity data is shown for two groups - the population as a whole, and the population of children for an area.
Below is a chart showing the data for Herkimer County as compared to New York State for that period of time. Note that food insecurity has remained relatively stable for children in NY, but seems to be climbing for children in Herkimer County. In terms of the overall population there is a small increase since 2009 for New York, while food insecurity for the total population of Herkimer County at first plummeted then rose between 2009 and 2013.
To see information for your area, please visit Feeding America and click on your county to get data similar to what is shown below (click to enlarge it).
 |
| CLICK TO ENLARGE |
