 |
| CLICK TO ENLARGE |
Wednesday, September 30, 2015
What Percent Are You?
From the New York Times comes an interactive map that allows you to see what "percent" you are when it comes to household income. Simply put in your household income and then zoom to the region to see how you compare. Below is a screen shot for a household with an income of $50,000. Click the graphic to enlarge it.
Tuesday, September 22, 2015
Total Traffic Accidents in Oneida County: 2007 to 2013
From New York State data, here is accident data for Oneida County.


Monday, September 21, 2015
2015 Single Year ACS Data Released for Oneida County

Each year, the Census Bureau releases three versions of the American Communities Survey (ACS). These are the 1-Year and the 5-Year ACS Estimates. PLEASE NOTE THAT THE 3 YEAR ACS HAS BEEN DISCONTINUED. These are released based on the population size of the municipality.
Five year estimates are released for EVERY level of census geography (down to the block group level) as well as every municipality (think town, city, and village). FIVE YEAR ESTIMATES WILL BE RELEASED IN DECEMBER OF 2016.
One year estimates are released for municipalities with a MINIMUM population of 65,000. This means they are mostly for counties and larger cities. For our region, ONLY ONEIDA COUNTY HAS SINGLE YEAR ESTIMATES AVAILABLE.
The most recent 1-Year Estimates are now a permanent part of this blog in the linked area just below the title above. A permanent link will take you to the most recent 1 year estimates post so you can always easily find this important data for both Oneida Counties !
Below are the individual links to the Demographic, Social, Economic and Housing Profiles for the 1 Year ACS Estimates for Oneida County.
2015 Oneida County ACS 1 Year Demographic Profile
2015 Oneida County ACS 1 Year Social Profile
2015 Oneida County ACS 1 Year Economic Profile
2015 Oneida County ACS 1 Year Housing Profile
2014 Single Year Estimates Released for Oneida County
 The 2014 single year American Communities Survey data has been released, meaning that new information is available for Oneida County. Remember, single year estimates are for geographies with populations of 65,000 or more. For our region that only covers Oneida County. I will post the links to the data profiles for Oneida County shortly, but until I do, here is a sort of comparative summary of things that are noteworthy and statistically significant when comparing the 2014 data to the data collected in 2010.
Significant Changes
in Oneida County Social Characteristics
- · Family composition is changing.
- · Fewer married couple families (from 49.5% in 2010 to 44.0% in 2014)
- · Increase in single male (4.1% in 2010 to 5.7% in 2014) and single female (10.2% in 2010 to 13.3% in 2014)) headed families
- · While the number of males age 15 and older has remained constant, there has been a significant decline in the number of females age 15 and older (roughly 97,700 in 2010 to 96,600 in 2014)
- · The percent of the population age 25 or older with a high school education or higher has increased significantly, from about 86% in 2010 to 89% in 2014.
- · More than half (57%) of the foreign born population has been naturalized according to 2014 data; this is significantly more than were naturalized as of 2010 (44%).
- · More households report having a computer in 2014 (84%) than in 2013, the most recent comparative year that this data was collected (79%)
Significant Changes
in Oneida County Economic Characteristics
- · Fewer workers age 16 and older are driving alone to work (84% in 2010 versus 81% in 2014); there has been a significant increase at the same time in the number of people working from home (2.3% in 2010 versus 4.4% in 2014)
- · While the per capita income and median household income have not changed significantly, median family income has seen a significant decline – dropping from $66,111 in 2010 to $61,147 in 2014.
- · Statistically the poverty rate for residents appears unchanged.
Significant Changes
in Oneida County Housing Characteristics
- · There are fewer owner occupied housing units in 2014 than in 2010 – 69% of housing was owner occupied in 2010 versus 65% in 2014. At the same time there has been an increase in renter occupied units.
- · Median owner occupied housing unit value has increased significantly, from about $106,000 estimated value in 2010 to $116,000 in 2014.
- · Median rent has remained the same statistically from 2010 to 2014.
Significant Changes
in Oneida County Demographic Characteristics
- · The number of people age 65 and over continues to increase significantly; in 2010 roughly 38,200 people were age 65 or older. In 2014, almost 40,700 residents were this old.
- · In 2014, more people identified themselves as being of a single race (96.9% said they were one race in 2010; 98.1% now identify as being of a single race). In particular, those identifying as African American and those identifying as Asian both saw increases in the percent of the population that said they were of one of these races only.
- · The overall minority population (this includes anyone who is not “white and non-Hispanic”) in Oneida County has grown significantly, going from 15.4% in 2010 to 17% in 2014.
Wednesday, September 16, 2015
New Census Web Tool Helps Business Owners Make Data Driven Decisions
The U.S. Census Bureau released Census Business Builder: Small Business Edition,
a new Web tool that allows business owners and entrepreneurs to easily
navigate and use key demographic and economic data to help guide their
research into opening a new business or adding to an existing one.
 |
| CLICK TO ENLARGE |
The
Census Business Builder was developed with user-centered design at its
core and incorporated feedback from customers and stakeholders,
including small business owners, trade associations and other government
agencies.
The
tool combines data from the American Community Survey, the economic
census, County Business Patterns and other economic surveys to provide a
complete business profile of an area. Business statistics include the
number of establishments, employment, payroll and sales. American
Community Survey statistics include population characteristics, economic
characteristics and housing characteristics.
If you want to go directly to the web tool, click here to launch the small business edition tool. Below is a sample screen shot for mapping the total consumer expenditures when dining out that might help a small business owner decide where they wanted to locate a new restaurant. Click the map to enlarge it.
 |
| CLICK TO ENLARGE |
Carbon Footprints of US Zip Code Areas

Using national household surveys, Christopher M. Jones and Daniel M. Kammen developed econometric models of demand for energy, transportation, food, goods, and services that were used to derive average household carbon footprints (HCF) for U.S. zip codes, cities, counties, and metropolitan areas. They then mapped the HCF for the entire country.
Below are a couple screen shots of the maps for the nation, state and zip code 13350. Click here to track down data on your zip code.
 |
| CLICK TO ENLARGE |
 |
| CLICK TO ENLARGE |
 |
| CLICK TO ENLARGE |
Tuesday, September 15, 2015
Neighborhood Obesity Maps for Entire United States

Obesity is not evenly distributed across the United States. From sources such as the Behavioral Risk Factor Surveillance System (BRFSS) and the National Health and Nutrition Examination Survey (NHANES), data show that the proportion of the population that is obese various across states and counties. And although obesity is a national problem, many of the policies and interventions that would be most valuable in reducing obesity occur at the community or neighborhood level.
Unfortunately, high-resolution maps of obesity at the community level do not exist. Without such maps, it is hard to know where the most at-risk populations are, or where to target outreach, interventions, and community health activities to use resources most efficiently.
This information gap—high resolution, community level maps and geographic data on obesity—is what RTI has tried to fill. So they constructed a highly detailed map (and associated GIS database) of obesity across the United States. They call this the Neighborhood Map of U.S. Obesity. The U.S. Obesity Map was created entirely from public, government data sources.
Below is a screen shot of the southern part of Herkimer County and it's obesity ranges. Blues indicate low levels of obesity, whereas reds indicate higher rates of obesity. Click the map to enlarge it, or visit the website and track down your neighborhood obesity rates.
 |
| CLICK TO ENLARGE |
Monday, September 14, 2015
Living Wage Gaps By Counties

Variations in the gap between living wage and minimum wage occur for a variety of reasons. A city with a relatively high minimum wage, for instance, may still show a large gap due to a high cost of living. Conversely, living expenses tend to be lower in rural areas, making even a relatively low minimum wage come closer to meeting basic household needs.
You can get Living Wage data for any county in the country from the link above. Below is the Herkimer County Data. Click to enlarge the table.
 |
| CLICK TO ENLARGE |
The MIT site also has a living wage map which includes similar data but allows you to see the data spatially. Below is the Herkimer County data and map. Go to their Living Wage Map to see the country, as well as New York State counties.
 |
| CLICK TO ENLARGE |

Wednesday, September 9, 2015
Mapping Local Immigration By Region of Origin

The regions include:
- Mexico (red);
- Latin America and the Caribbean, other than Mexico (blue);
- East and Southeast Asia (green);
- South Asia (aqua);
- Sub-Saharan Africa (purple);
- North Africa & Southwest Asia (pink);
- Europe (orange);
- Oceania (yellow);
- Canada (brown)
Below is a screenshot of the greater Utica area from the link above. Click the map to enlarge it.
 |
| CLICK TO ENLARGE |
Tuesday, September 8, 2015
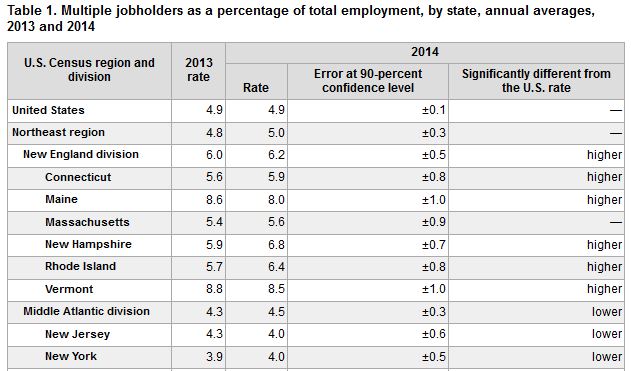
UPDATE: Moonlighting in the 21st Century - Multiple Job Holders By State
In January of last year I posted a piece about workers who held multiple jobs. This has since been update from 2012 data to 2014 data. While not a lot has changed in terms of BLS data for NYS, it is still interesting to look at the country as a whole.
Below is an updated map as well as some information on New York for 2013 and 2014. Click to enlarge either.
Below is an updated map as well as some information on New York for 2013 and 2014. Click to enlarge either.
 |
| CLICK TO ENLARGE |
 |
| CLICK TO ENLARGE |
Ranking the Ability to Secure Mortgages in NYS Counties
SmartAsset provides an interactive map of the county (and New York State) that highlights the best counties for securing a mortgage. If you go to the link provided above and hover over each county you can see the data points for each one. You can also use the tabs at the top of the map to view the factors that drive the analysis used by SmartAsset to make their determinations.
Below is a sample of what you can see when I hovered over Herkimer County. Click to enlarge it.
Below is a sample of what you can see when I hovered over Herkimer County. Click to enlarge it.
 |
| CLICK TO ENLARGE |
Tuesday, September 1, 2015
Highway Performance Monitoring System: Seeing Traffic Density in Your Neighborhood

Roads on the map with traffic density data are colored yellow. The thickness of the yellow lines on the map relate to the amount of traffic. Thick lines indicate more traffic and thinner lines less traffic. Zoom in on the map and you can view the average number of vehicles per day for different sections of roads.
Visit the site and zoom in to your neighborhood to see how many vehicles travel daily on some of the local roads where you live. Below happens to be a screen shot of the Village of Herkimer, with some rudimentary roads labeled by me. Click on the map to enlarge it.
 |
| CLICK TO ENLARGE THE MAP |
Subscribe to:
Posts (Atom)