Thursday, March 29, 2012

Urbanized Areas Released by Census Bureau for 2010 Census

Every decennial census, the Census Bureau releases reconfigured maps showing the new urban areas across the country. Urban areas, and especially urbanized areas which are a subset of the urban area, are especially important to local and regional governments since a HUGE amount of federal funding is based on this designation. Many federal resources have an urban component geared toward basing its funding awards on the size of the urbanized area being served. This is especially true of many highway and traffic safety programs.

In the Census 2000, the Herkimer Oneida Counties region lost two major parts of its "urbanized area" due to changes in the definitions at that time. Rome got excluded from the urbanized area and was re-categorized as an "urban cluster", while the main swath of villages in the valley in Herkimer County were eliminated from either category. While they remained "urban" they were deemed neither part of the "urbanized area" or part of any "urban cluster".

This exclusion of population from the region's urbanized area resulted in considerable loss of federal aid that otherwise would have been available. Simply put, fewer people in the redefined urbanized area resulted in access to less funding.

For the Census 2010, the main concepts of the "urbanized area" definitions in the Census 2000 were kept, with a few tweaks added. The result for our region is a similar looking urbanized area - one that shows a slight increase of roughly 4,000 people over the population found inside of its boundaries during the Census 2000.

Below, then, are three maps worth looking at - the NEW urbanized areas and clusters for 2010, the OLD urbanized areas and clusters from 2000, and a map showing the old areas imposed on top of the new ones for comparison sake.

2010 Urban Areas 2000 Urban Areas 2010 and 2000 Comparison


A Brief History of What It Is to Be Urban or Rural

Statistics have been split into urban and rural categories in decennial census publications for over a century. The definition of "urban" has changed over time in response to changes in settlement patterns, data use needs, and technology available for use in defining urban areas. The Census Bureau has continued to define "rural" as all territory, persons, and housing units not defined as urban. In the censuses of 1880, 1890, and 1900, places were deemed urban based on minimum population sizes of 8,000, 4,000, and 2,500 inhabitants respectively.

Beginning in 1910, the minimum population threshold to be categorized as an urban place was set at 2,500. "Urban" was defined as including all territory, persons, and housing units within an incorporated area that met the population threshold. The 1920 census marked the first time in which over 50 percent of the U.S. population was defined as urban.

The Census Bureau revised the urban definition for the 1950 census by adopting the urbanized area concept, to better account for increased growth in suburban areas outside incorporated places of 50,000 or more population. This change made it possible to define densely-populated but unincorporated territory as urban. The Census Bureau continued to identify as urban those places that had populations of 2,500 or more and were located outside urbanized areas. The Census Bureau also officially identified unincorporated places (referred to as census designated places (CDPs) starting with the 1980 census) located outside urbanized areas for the first time in 1950, and designated as urban any that contained at least 2,500 people within its boundaries. In 1960, the Census Bureau also adopted a population density threshold of at least 1,000 people per square mile for urbanized areas.

In the Census 2000, the Census Bureau adopted the urban cluster concept, for the first time defining relatively small, densely settled clusters of population using the same approach as was used to define larger urbanized areas of 50,000 or more population, and no longer identified urban places located outside urbanized areas. In addition, all urbanized areas and urban clusters were delineated solely on population density, without reference to place boundaries (for the 1950 through 1990 censuses, places were included in, or excluded from, urbanized areas in their entirety; exceptions were made for incorporated places containing substantial amounts of sparsely populated territory).

For the 2010 Census, the Census Bureau will be relying largely on what was established in the 2000 Census. An urban area will comprise a densely settled core of census tracts and/or census blocks that meet minimum population density requirements, along with contiguous territory containing nonresidential urban land uses as well as territory with low population density included to link outlying densely settled territory with the densely settled core. To qualify as an urban area on its own, the territory identified according to the criteria must encompass at least 2,500 people, at least 1,500 of which reside outside institutional group quarters. Urban areas that contain 50,000 or more people are designated as urbanized areas (UAs); urban areas that contain at least 2,500 and less than 50,000 people are designated as urban clusters (UCs). The term "urban area" refers to both UAs and UCs. The term "rural" encompasses all population, housing, and territory not included within an urban area.

Maps of Herkimer and Oneida County CDPs

Ok, so now that we know what CDPs are - Census Designated Places, meaning unincorporated communities such as hamlets, known by a commonly accepted name which have a variety of residential, commercial and retail areas - where exactly are they in our region ?

Well below you will find maps of each of our seven CDPs. The Census Bureau encourages the creation of such entities, so if you know and area that might make for a good CDP in the future, let me know !

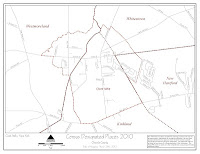
Old Forge CDP Chadwicks CDP Clark Mills CDP
Durhamville CDP Verona CDP Washington Mills CDP
Westmoreland CDP

Friday, March 23, 2012

A Rose by Any Other Name....What IS a CDP Anyways?

Occasionally someone will ask me "What is a CDP anyways?"

CDPs, in the world of the Census Bureau, stands for Census Designated Places. Technically the definition goes something like this - Census designated places (CDPs) are closely settled, named, unincorporated communities that generally contain a mixture of residential, commercial, and retail areas similar to those found in incorporated places of similar sizes. Got it ?

Let's look at this a little more closely. First, they are closely settled, meaning that CDPs have multiple residents that are housed (in some sense) relatively close to one another. Second, they are unincorporated, meaning that they are NOT a village. Villages already get special consideration in the census. Often, CDPs are what might be called "hamlets", although that designation does have a special connotation to it as well in New York. Third, they contain a mixture of residential, commercial and retail areas. This isn't a strict requirement but it would bolster the argument for creating or selecting an area as a CDP.

Probably MOST important in the process is the fact that they are NAMED ! So if you were to say "I'm heading to CDPville," people would know pretty much exactly where you were talking about. The names are something that are commonly used to describe the location in question.

The best example of a CDP (at least since the 2010 census was conducted) is Old Forge in northern Herkimer County. Old Forge is NOT a village - it is not incorporated as such. Yet people know exactly where you mean if you say you are heading to Old Forge. It also has a nice mix of residential, commercial and retail areas. And clearly, it is closely settled. So Old Forge was a perfect spot for the creation of a CDP in order to gain census data about that specific area.

Oh course the devil is always in the details - and specifically that means the details of EXACTLY what you include when you designate the place as Old Forge. For example, should it include Thendara ? Or should it stop on its southern border at the Moose River ? And how far north does it stretch, to say nothing about east and west? Regardless, through conversations with locals and the Census Bureau, a boundary was arrived at. As a result, there is now census data available for the CDP of Old Forge !

You can see 5-Year American Community Survey profiles for ALL of the CDPs in Herkimer and Oneida Counties by clicking on the links below. These include demographic, social, economic and housing profiles for Clark Mills, Chadwicks, Durhamville, Old Forge, Verona, Washington Mills and Westmoreland.

2006-2010 ACS Demographic Profiles for Herkimer and Oneida Counties CDPs

2006-2010 ACS Social Profiles for Herkimer and Oneida Counties CDPs

2006-2010 ACS Economic Profiles for Herkimer and Oneida Counties CDPs

2006-2010 ACS Economic Profiles for Herkimer and Oneida Counties CDPs

Thursday, March 22, 2012

ACS Community Profile: Ilion

The American Communities Survey (ACS) provides snap shots of municipalities each and every year. For many of our communities, this represents the only source of data for things such as education, poverty, and transportation issues. As part of an effort to bring this data to the public's eye, I like to occasionally post the profiles for some of our smaller towns and villages.

Below are links to the demographic, social, economic and housing profiles for Ilion, NY, which can be found through the ACS. To learn more about this prominent village in Herkimer County, visit the New York Genweb site.


In the meantime, here are links to the ACS profile data for Ilion !

2006-2010 ACS Demographic Profile for Ilion

2006-2010 ACS Social Profile for Ilion

2006-2010 ACS Economic Profile for Ilion

2006-2010 ACS Housing Profile for Ilion

Tuesday, March 20, 2012

Understanding Margins of Error (MOE) in the ACS

The American Communities Survey (ACS) is the primary data source for communities since the demise of the long form from the decennial census process. For information about what the ACS is, and it’s relationship to the census, you might want to revisit this previous blog post.

Since the ACS is based on a smaller sample than the decennial census long form used to be, it has more variability in it’s statistics. Think of it this way, if you surveyed every single person in a community you would know with 100% accuracy how much money they made last year. If you only asked 1 out of every 7, you would still probably have a pretty good idea, but there would be a bit of measurement error in your number. So there would be some level of variability. But now imagine you only interview 1 out of every 50 people. You’d still have an income level to report but the amount of variance in your data would probably be a bit larger.

That’s the difference between ACS data and the decennial census data. The census “short form” was used to survey every single household. The long form only went to 1 in 7 households. Now along comes the ACS which only goes to 1 in roughly 50 households. The variability of the data is much greater when the sample size is smaller,

This is why there ACS provides “margins of error”, or MOEs. The MOEs provided in the ACS basically tell you that you can have 90% confidence that the ACTUAL number if you survey 100% of the community would be between the number provided and plus or minus the margin of error. Let’s use an example.

According to the 2010 One Year ACS estimate, the median household income in Oneida County is $47,286. The MOE (margin of error) is +/- $2,128. So that means that if you go above and below the median income level reported by $2,128, you can be 90% confident that the actually household income level is within that range. More specifically, I am 90% sure that the median household income in Oneida County is between $49,414 and $45,158 .

Why is this important to think about ? Well, numbers with really REALLY large MOE suggest that the data is less reliable. It might be interesting to know and give you a clue as to conditions for an area, but if the margin of error was HUGE it should also give you pause. Think about it this way – if in the last example the MOE for median income was +/- $40,000, that would mean we would feel confident that the median income was between $87,286 and $7,286 ! That really isn’t a particularly useful range of data for talking about median household income !

I’ll make a separate post on the importance of properly interpreting margins of error. In the meantime, keep the MOEs in mind as you look at ACS data ! And when they begin to exceed 20% of the base number being measured, you should at the very least take a moment to look at the data more closely and use caution in interpreting it.

Monday, March 19, 2012

It's A Wonderful Day in the Neighborhood !

Welcome to the Neighborhood !

Defining neighborhoods, in census terms, is not an easy prospect. Neighborhoods, well often well defined, do change over time as in and out migration, as well as the aging of populations, occurs. However, for the most part they generally remain in place for fairly lengthy periods.

One of the sets of data we get requests for in particular is for “neighborhoods” in the City of Utica. Such requests pose problems on several levels. The first is a matter of definition – what exactly ARE the neighborhoods of Utica ? And secondly, there is of course the issue of does any data exist for these specific areas being looked at?

Since 1980 data has been developed for what are seven distinct sections of the city. While there can be much debate about the boundaries of each area, they are historical “neighborhoods” from the standpoint of the availability of census data if nothing else. These seven can be seen on the map below, and include: East Utica, West Utica, North Utica, South Utica, Southeast Utica, Center City Utica, and Cornhill.

Neighborhood data exists then since about 1980 through the 2000 Census for Utica. Currently there is no such data put together for the 2010 Census, but efforts are underway to get at similar data for these areas of the city.

In the meantime, here is a basic three page demographic profile for the seven neighborhoods comprising Utica from the 2000 Census.


Population Flows from Cities and Villages to Towns


One of the great "truths" of demographics in the past 50 years has been the outflow of people from cities and villages to more rural settings. In a phrase, it's referred to as "urban flight".

Oneida County has seen considerable evidence of this in census data. The table below shows the change in population for cities, villages and remainders of towns (ROTs)from 1960 until the most recent census in 2010. ROTs are basically the town populations minus the village populations.

As you can see, since the 1960 census, the cities in Oneida County have experienced a decline of more than a third (36%) of their population. Villages, while not losing nearly as great a percentage, have lost more than a tenth (13%). ROTs on the other hand have seen their populations increase by about 34% ! This despite an over all loss of population for the county as a whole since 1970.

As a result, town populations (that is to say the populations in the parts of towns NOT in villages) now exceeds city populations in the county, and has done so since the year 2000. While approximately 99,000 people now live in one of the three cities in Oneida County, nearly 110,000 live in the non-village portions of its towns.

Interestingly, the number of people (population = 109,197) living in the ROTs has remained the same since the Census 2000. And by the same I mean EXACTLY the same ! Could this be a sign of a change in this trend ? With no real way to know, we will have to wait for another 8 years until the 2020 census to get a better view of where this trend is heading locally.

Thursday, March 15, 2012

2010 Census General Profiles for Every Municipality in The Region


The Census Bureau releases a HUGE amount of data for municipalities. Trying to provide ALL of the data to those in need is not really practical in a blog, or any other way short of going to the Census Bureau's American Fact Finder website.

However, the Empire State Development Office of NYS has made what are called "general profiles" available to the affiliates (and the public as well) on every single municipality across the state. The profiles are nine pages long per municipality and cover the most basic data from the 2010 Census - things like age, race, sex and household data. It does NOT include items such as education, poverty, or employment data. Remember that the decennial census now only covers 8 or so questions. Information on things like poverty, education, etc., are now available through the American Communities Survey (ACS), which is done on an annual basis. To learn more about the ACS you might want to read this earlier post.

In the meantime, the General Profiles for every town, village and city, as well as the "remainder of towns" (i.e. a town's population MINUS all villages within it) appears below for both Herkimer and Oneida Counties. They are arranged alphabetically (after the County data is presented in the first 9 pages) by town, with village data following the town in which it is located. These can answer many of your questions about the Census 2010 data for your municipality !

The files (pdfs) are large, so be patient as they load for your viewing !

Herkimer County Municipalities' Census 2010 General Profiles

Oneida County Municipalities' Census 2010 General Profiles

Tuesday, March 13, 2012

Utica and Rome Hispanic Population Concentrations

the singular fastest growing segment of our population is among Hispanic peoples. The term "Hispanic" in the census is used as an ethnic identifier, not a racial category. Hence many people may identify them by one of the traditional race categories (Caucasian, African American, Asian, etc.) but also indicate that they are Hispanic. These are not mutually exclusive categories by Census definition.

Below are three maps showing the concentration of persons who identified themselves as ethnically Hispanic in the 2010 Census for the Utica and Rome metro areas, based on block group geography.


Statewide County Housing Data: Occupied Units, Persons and Vacancies

Sometimes it is important to put local census data in perspective within the context of the state. Provided below are data on housing, occupancy, vacancies and tenure for each county in the State based on the Census 2010 data.

Friday, March 9, 2012

Census Releases Income Disparity Report for Counties in US

The Census Bureau released a report yesterday on Household Income Disparity in US Counties which shows how each county in the US ranks on the Gini Index. The Gini Index is a summary measure of income inequality. As an index, it only has a value of between 0 and 1. A value of "0" would mean that every household had the same exact income; a value of "1" would mean that income was concentrated solely in a single household.

Nationally the value ranges from .645 in East Carroll Parish in Louisiana, to .207 in Loving County in Texas. This would mean that the place where the MOST DISPARITY or inequality of income exists is in East Carroll, LA and the county where the MOST EQUITY exists is in Loving County, TX. The map below shows the entire country spatially on the Gini Index.


So how do we fair regionally ? Well in Herkimer and Oneida Counties the Gini Index is .411 and .432, respectively. In essence we are pretty much in the middle of the range of inequity. Below are some income data for both counties based on the same data as the Census study - the 2006-2010 ACS data.

Religious Traditions and SubFamilies for Herkimer and Oneida Counties


One of the most difficult pieces of data to find, and yet one of the most asked about, is religious affiliation and congregation information. There is only one source that I have ever found with any county level data available and that is the Association of Religion Data Archives.

The ARDA strives to democratize access to the best data on religion. Founded as the American Religion Data Archive in 1997 and going online in 1998, the initial archive was targeted at researchers interested in American religion. The targeted audience and the data collection have both greatly expanded since 1998, now including American and international collections and developing features for educators, journalists, religious congregations, and researchers. Data included in the ARDA are submitted by the foremost religion scholars and research centers in the world.

While ARDA has done its own survey work, they haven't done a nation wide survey of congregants since 2000. They are hoping to complete a new survey sometime this year, however. In the meantime the most recent data source with County level information that they cite on the website comes from InfoGroup USA. This is the result of data they collected during the 2009.

In addition to using Yellow and White pages to collect basic information, InfoGroup associates utilize denominational directories and web research to enhance the data with additional information including religious denomination, congregational size, worship attendance, church school size, and various church ministries. New congregations are identified through utility connects and other public sources. In the final stage of compilation, congregations are called by phone to verify and enhance listed information. Throughout all stages of compilation, associates attempt to collect names and email addresses for three congregational leaders: senior clergy (person in charge), youth clergy, and the music ministry contact.

This data is then assigned as belonging to a religious "tradition" as well as a religious "family". Religious Traditions categorize groups based on current religious beliefs and acceptance of the larger culture, but give little attention to denominational lineage. Religious Families organize religious groups based on their common religious ancestry or heritage, regardless of their current religious beliefs or social positions.

Below is the 2009 data for both Herkimer and Oneida Counties. It includes the traditions and families data breakouts.


Thursday, March 8, 2012

Single Year ACS Data for Oneida County

Each year, the Census Bureau releases three versions of the American Communities Survey (ACS). These are the 1-Year, the 3-Year, and the 5-Year ACS Estimates. These are released based on the population size of the municipality. Five year estimates are released for EVERY level of census geography (down to the block group level) as well as every municipality (think town, city, and village). Three year estimates are only released for geographies or municipalities with a MINIMUM population of 20,000 persons. So many smaller villages and towns are excluded. One year estimates are released for municipalities with a MINIMUM population of 65,000. This means they are mostly for counties and larger cities. For our region, ONLY ONEIDA COUNTY HAS SINGLE YEAR ESTIMATES AVAILABLE.

The most recent 1-Year Estimates are now a permanent part of this blog in the linked area just below the title above. A permanent link will take you to the most recent 1 year estimates post so you can always easily find this important data for both Oneida Counties !

Below are the individual links to the Demographic, Social, Economic and Housing Profiles for the 1 Year ACS Estimates for Oneida County.

Oneida County 1 Year ACS Demographic Data 2010

Oneida County 1 Year ACS Social Data 2010

Oneida County 1 Year ACS Economic Data 2010

Oneida County 1 Year ACS Housing Data 2010

Regional ACS Three Year Estimates Now Available

Each year, the Census Bureau releases three versions of the American Communities Survey (ACS). These are the 1-Year, the 3-Year, and the 5-Year ACS Estimates. These are released based on the population size of the municipality. Five year estimates are released for EVERY level of census geography (down to the block group level) as well as every municipality (think town, city, and village). Three year estimates are only released for geographies or municipalities with a MINIMUM population of 20,000 persons. So many smaller villages and towns are excluded. One year estimates are released for municipalities with a MINIMUM population of 65,000. This means they are mostly for counties and larger cities.

The most recent 3-Year Estimates are now a permanent part of this blog in the linked area just below the title above. A permanent link will take you to the most recent 3 year estimates post so you can always easily find this important data for both Herkimer and Oneida Counties !

Below are the individual links to the Demographic, Social, Economic and Housing Profiles for each county, side by side in a single pdf.

Regional 3 Year ACS Demographic Data 2008-2010

Regional 3 Year ACS Social Data 2008-2010

Regional 3 Year ACS Economic Data 2008-2010

Regional 3 Year ACS Housing Data 2008-2010

Vacant and Seasonal Housing Data for Oneida County Towns

The table below shows vacant and seasonal housing for towns in Oneida County. The data comes from the Census 2010 and indications are that about a third of all vacant housing in the towns is due to seasonal housing. The Town of Forestport has far and away the highest concentration of seasonal housing, with more than 60% of ALL housing being seasonal housing. The next highest concentrations are in Remsen and Vienna.

Wednesday, March 7, 2012

NYS Board of Realtors Data: Housing Sales 2009 - 2011

The New York State Association of Realtors tracks the number of sales and median sales price of existing single-family homes sold by Realtors. Reports are available on a monthly, quarterly, annual and year-to-date basis on their website.

In the meantime, here is the most recent data for Herkimer County, Oneida County, and New York State.

Regional ACS Five Year Estimates Now Available

Each year, the Census Bureau releases three versions of the American Communities Survey (ACS). These are the 1-Year, the 3-Year, and the 5-Year ACS Estimates. These are released based on the population size of the municipality. Five year estimates are released for EVERY level of census geography (down to the block group level) as well as every municipality (think town, city, and village). Three year estimates are only released for geographies or municipalities with a MINIMUM population of 20,000 persons. So many smaller villages and towns are excluded. One year estimates are released for municipalities with a MINIMUM population of 65,000. This means they are mostly for counties and larger cities.

What this means for municipalities is that in some cases (Oneida County for example), each year there are 3 levels of ACS released - the 1-Year, the 3-Year and the 5-Year ACS estimates ALL include Oneida County data. Other communities, like Herkimer County, only have two versions of the ACS that cover them - the 3-Year and the 5-Year estimates. And even stiil, smaller areas, say the village of Newport, only can find annual updates of data in the 5-Year estimates.

Each of these types of ACS releases have advantages and disadvantages. The rule of thumb, when multiple versions are released and available, is that you should use the 1-Year or 3-Year estimate when you are looking for the NEWEST data out there. They cover the most recent time frame for release of data. Because they have smaller sample periods (1 or 3 years) they also have the greater variability, so that is the downside of using them. On the other hand, you should use the 5-Year estimates when you are looking for the most accurate data, or perhaps the better way to say it is when you want to see the data with the least variability.

Regardless, the most recent 5-Year Estimates will now become a permanent part of this blog in the linked area just below the title above. A permanent link will take you to the most recent 5 year estimate post so you can always easily find this important data for both Herkimer and Oneida Counties !

Below are the individual links to the Demographic, Social, Economic and Housing Profiles for each county, side by side in a single pdf.

Regional 5 Year ACS Demographic Data 2006-2010

Regional 5 Year ACS Social Data 2006-2010

Regional 5 Year ACS Economic Data 2006-2010

Regional 5 Year ACS Housing Data 2006-2010

Tuesday, March 6, 2012

2008 HUD Based Foreclosure Rates Mapped for NYS Census Tracts

The last several years have seen considered economic upheaval, especially for home owners. The attached map is provided as a way to visualize the percentage of properties foreclosed on during 2008, at the height of the housing bust. These data, which come from the U.S. Department of Housing and Urban Development, were mapped on a tract level for the entire state.

Spanish Speaking Populations in Oneida County

One of the fastest growing segments of the County's population are Hispanic people. The map below shows the concentration of people speaking Spanish at home for block groups in Oneida County. It is based on the 2005-2009 American Communities Survey.

Friday, March 2, 2012

2011 Oneida County Teen Assessment Program Survey Results

In May 2011, 2,240 seventh, ninth and eleventh grade students from 13 school districts, participated in the Oneida County Teen Assessment Project(TAP) Survey. The Teen Assessment Project (TAP) Survey is a voluntary and anonymous student survey that communities throughout the United States have used to document the concerns, perceptions and behaviors of teens. Dr. Stephen Small from the University of Wisconsin, Cooperative Extension, developed the survey in 1988.

The best way to know how our youth are doing is to ask them directly. The TAP Survey provides a safe, confidential and anonymous way for a large number of youth to respond directly to a wide range of questions. The questions cover such topics as - how they spend their time, the importance of their education, what worries them, how closely parents monitor their behavior, substance abuse, sexuality and much more. Their responses to these questions are documented and analyzed in this report. This provides a unique assessment on the status of youth in Oneida County.


The report reviews the findings from this survey, looks at trends using the results from the three previous TAP Surveys conducted in 1999, 2003 and 2007, and compares these local findings with national survey results. The 2011 Oneida County Teen Assessment Project (TAP) Survey is the fourth one the Herkimer-Oneida Counties Comprehensive Program (HOCCPP) has conducted. Since the first done in Oneida County in 999, HOCCPP has administered the survey every four years. Oneida County now has valuable local information regarding the concerns, perceptions and behaviors of our youth that spans 12 years.

If you are interested in seeing the survey in its entirety you can download the 2011 Oneida County TAP Survey Report. If you have questions about the survey or the report, you can contact Chip Bassett, a Principal Planner with HOCCPP, at cbassett@ocgov.net.

Here are several slides showing data concerning smoking, drinking, marijuana use, and mental health/suicide ideation issues. Much more data is available in the report !


Thursday, March 1, 2012

Finding Herkimer and Oneida County Basic Data And Maps On This Blog

One of the reasons I wanted to start this blog was to make it easier for policymakers and the public to get easy access to the regions most commonly sought after data. These are the basic historical data for each county and every municipality, as well as the most recent releases of American Communities Survey data. In addition, there are also links to my posts on both counties' Census 2010 Tract Maps. These are the maps used for the 2010 Census data.

To make access as easy as possible, I have now added permanent links just below the blog title as means for anyone to get to these data quickly. You can now access either county's historical or ACS demographic data, as well as their tract maps, with a click of the appropriate link above. Hopefully this will improve your ability to find the things you need when it comes to Census related data for your projects !