Tuesday, April 28, 2015

Living On The Edge: The Regional Population In "Near Poverty"

A day or so ago I posted about deep poverty and children in "deep poverty", "in poverty", and in "near poverty". Someone subsequently asked me about those living in "near poverty" so I wanted to share these findings.

For our purposes here, let's use the following for definitional purposes. Most government measures of poverty identify three levels, or depths, of poverty: "near poverty", "in poverty", and "deep poverty". Of course there is also that portion of the population that is above poverty.

"Near poverty" identifies, in this case, people who live in a family where the income level is between 150% and 101% of poverty income guidelines. So technically they are not in poverty at this time, but considered to be on the edge of poverty, or living in "near poverty".

"In poverty" identifies people where their family level of income is between the actual poverty level (100% of the poverty income level) and 51% of the poverty income level.

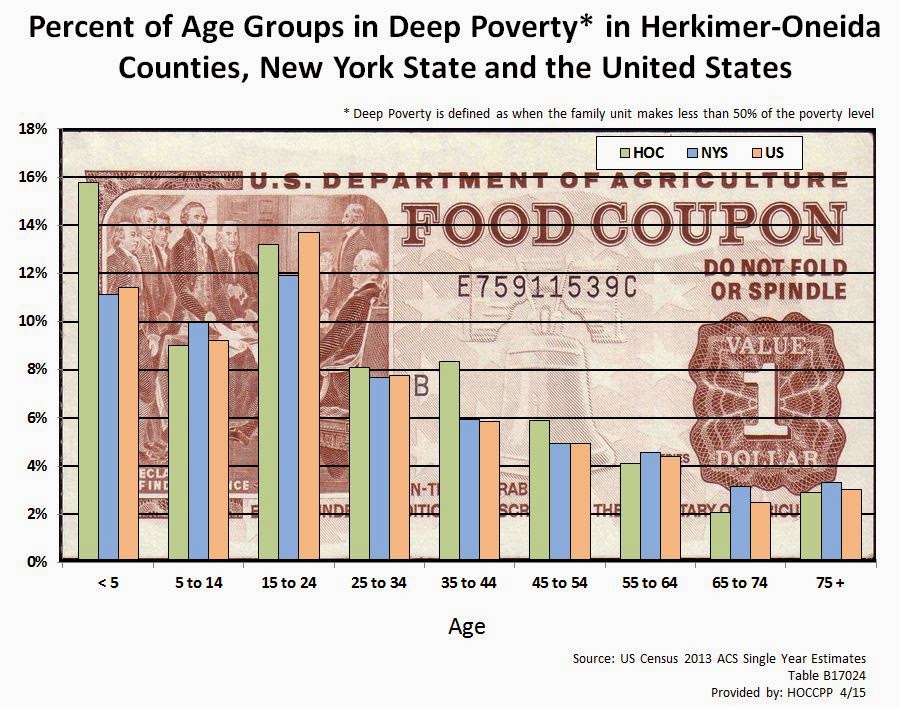
People living in "deep poverty" are those where families are at 50% or less of the poverty income guidelines. For these families, they are a long ways from getting out of poverty, hence the idea that they are seen as being in "deep poverty".

Below is a chart showing, by age groupings, the percent of population in "near poverty" for our region. These are compared to the state and national data in the chart. Click on it to enlarge the chart.

CLICK TO ENLARGE


Of the roughly 277,000 people who have had their level of poverty identified in the region, some 28,000 live at the edge of poverty, or in "near poverty". The list below provides some insight into who they are, and how they live.


Ten Things About People Living In "Near Poverty"

In The Herkimer-Oneida Counties Region You Probably Didn't Know


  1. People living in “near poverty” are more than twice as likely to be Hispanic than those not in poverty.  About 7.2% of those in “near poverty” are Hispanic while only 3.1% of people living above poverty have a Hispanic heritage.  Interestingly, those actually living in poverty are even more likely to be Hispanic (9.2%).
  2. People living in “near poverty” are significantly more likely to be foreign born. More than one in ten (10.5%) of those in “near poverty" are foreign born. Only 9.0% of people living in actual poverty and 4.5% of the population living above poverty are foreign born.
  3. The population living in “near poverty” are significantly more likely to speak something other than English at home (16.6%). (In poverty – 10.7%;  above poverty –7.7%)
  4. Unemployment for those living in “near poverty” is around 12% (In poverty – 29%;  above poverty –5%)
  5. About one in three people living in “near poverty” are married (32%); one out of every four are either divorced or separated (25%).  (In poverty - 21% and 29%, respectively;  above poverty – 53% and 14%, respectively)
  6. About half (50%) of people living in “near poverty” worked in the last year. However as many as 42% haven’t worked in 5 years or have never worked. (In poverty - 34% and 48%, respectively;  above poverty – 68% and 26% respectively)
  7. About one in five of those living in “near poverty” (19%) claim to have a disability. (In poverty – 26%;  above poverty –14%)
  8. About 14% of all people living in “near poverty” are racially non-white. (In poverty – 26%;  above poverty –9%)
  9. Nearly one out of five people living in “near poverty” are age 65 or older (19%). (In poverty – 9%;  above poverty –20%)
  10. More than a quarter (28%) of those living in “near poverty” are children under the age of 18. (In poverty – 33%;  above poverty –17%)
Source: US Census 2013 Single Year ACS PUMS data

Monday, April 27, 2015

Deep Poverty Within Age Groups for the Region, NYS and the US (2013)

A continuing look at those in deep poverty. The chart below shows the percent of people in deep poverty (defined as those living in families where the income level is less than 50% of what defines poverty for that particular family structure) within various age groupings. Data from the Herkimer Oneida County region, as well as New York State and the United States, is provided.

Click to enlarge the graph for better viewing.

CLICK TO ENLARGE

Comparison of Children in Poverty 1990 Versus 2013

Recently I posted about regional children living in poverty. In that post I introduced the concepts of people living in "near poverty, "in poverty" and in "deep poverty".

"Near poverty" identifies, in this case, children under the age of 18 who live in a family where the poverty level is between 150% and 101% of poverty. So technically they are not in poverty at this time, but considered to be on the edge of poverty, or "near" poverty.

"In poverty" is for children where their family level of income is between the actual the poverty level (100% of the poverty income level) and 51% of the poverty income level.

Children in "deep poverty" are those where families are at 50% or less of the poverty levels. For these families, they are a long ways from getting out of poverty, hence the idea that they are seen as being in "deep" poverty.

The previous post just took a look at the current percentage of children in the two county area that live at each of these poverty levels. In order to provide a bit more context, here is some data that covers the regional MSA (Herkimer and Oneida Counties combined), New York State, and the United States for the years 1990 and 2013 for children in poverty. Each has seen an increase in levels of poverty pretty much across the board.

Please NOTE: In order to get the percentage of children living in poverty as more traditionally defined, you would simply add the percentages of the bottom two segments on the graph below - that is, add the percent of those in "deep poverty" to the percent "in poverty". 


Friday, April 24, 2015

Regional Children in Poverty: Kids In "Near Poverty", "In Poverty" and In "Deep Poverty"

We often talk about people, and especially children, in poverty. Not all levels of poverty are seen the same. Most government measures of poverty identify three levels, or depths, of poverty: "near poverty", "in poverty", and "deep poverty".

"Near poverty" identifies, in this case, children under the age of 18 who live in a family where the poverty level is between 150% and 101% of poverty. So technically they are not in poverty at this time, but considered to be on the edge of poverty, or "near" poverty.

"In poverty" is for children where their family level of income is between the actual the poverty level (100% of the poverty income level) and 51% of the poverty income level.

Children in "deep poverty" are those where families are at 50% or less of the poverty levels. For these families, they are a long ways from getting out of poverty, hence the idea that they are seen as being in "deep" poverty.

The graphic below shows depth of poverty among all children age 17 and under in the region. While a total of around 27% are actually below poverty, you can see how a large portion of the 27% are in deep poverty (11%). In addition, another 16.0% are hovering near poverty.


Thursday, April 23, 2015

Median Housing Values in Herkimer County

These are the median housing values of owner occupied households in towns and the City of Little Falls according to the 2013 ACS Five Year Estimates. Click to enlarge the map and make it more readable !

HERKIMER COUNTY MEDIAN HOUSING VALUES OF OWNER OCCUPIED HOUSEHOLDS

CLICK TO ENLARGE

Languages Spoken At Home Other Than English (2013)

Regionally speaking.....


However in those 1 out of 10 households...

CLICK TO ENLARGE

To see a more specific listing of locally spoken languages, see this older post about languages spoken at home!

Wednesday, April 22, 2015

Earth Day By The Numbers (2015)

Renewable Energy

$9.8 billion
Revenues in 2012 for electric power generation industries that use renewable energy resources, such as hydro, wind, geothermal, biomass, solar and other electric power generation. This figure is up 49.0 percent from $6.6 billion in 2007.

697
The number of wind, geothermal, biomass, solar and other electric power generation business establishments in 2012, up from 312 in 2007.

5,456
The number of employees in wind electric power generation, the most among the industries using renewable energy in 2012.

$5 billion

Revenues for the wind electric power generation industry in 2012, the highest among the industries using renewable energy resources. Hydroelectric power generation followed with revenues of $2.4 billion. Geothermal electric power generation had revenues of just under $1 billion ($995.4 million), followed by biomass electric power generation, with $934.6 million in revenues, solar electric power generation, with $472.4 million, and other electric power generation, with $59.0 million.

Source: 2012 Economic Census


Heating and Cooling the Home

2.4 million
Estimated number of occupied housing units across the country heated by wood in 2013, which is 2.1 percent of all homes.

50,235
Estimated number of occupied housing units across the country totally heated by solar energy in 2013.

56.8 million
Estimated number of occupied housing units across the country heated by utility gas in 2013, which is 49.1 percent of all homes.

Source: 2009-2013 American Community Survey five-year estimates, Table B25040.

91%
Estimated percent of newly built single-family homes across the country with air-conditioning in 2013.

Source: 2013 Characteristics of New Housing
Presence of Air-Conditioning in New Single-Family Houses Completed


Commuting to Work

25.8 minutes
Estimated average time for workers age 16 and older across the country spent getting to work in 2013, up from 25.7 minutes in 2012 and 25.5 minutes in 2011.

32.5 and 32.1 minutes
Estimated average time for workers age 16 and older in Maryland and New York spent getting to work in 2013, the longest commute time in the nation. (The two times are not statistically different.) Maryland’s time is up from 31.8 minutes in 2012.

17.9
Estimated average time workers age 16 and older in North Dakota and Wyoming spent getting to work in 2013, the shortest one-way commute times in the nation.

882,198
Estimated number of people who rode a bicycle to work in 2013. This comes out to about 0.6 percent of the American workforce.

4,000,459
Estimated number of people who walked to work in 2013. This comes out to about 2.8 percent of the American workforce.

Source: 2013 American Community Survey


Working in the Nuclear and Forestry Fields

53,515
Number of workers employed in forestry and logging (NAICS 113) across the U.S. in 2012, up from 53,034 in 2011. They had an average annual salary of $39,616, up from $37,986 in 2011.

Source: 2012 County Business Patterns

52,906
Number of workers employed in nuclear electric power generation (NAICS 221113) across the U.S. in 2012.

82.3%​
Increase in the number of nuclear electric power generation (NAICS 221113) establishments across the U.S. in 2012, from 79 establishments in 2007 to 144 establishments in 2012.

$950.0 million
Increase in revenue by nuclear electric power generation (NAICS 221113) establishments, from $29.0 billion in 2007 to $29.9 billion in 2012.

Source: U.S. Census Bureau, 2012 Economic Census and 2007 Economic Census


Using Energy

18,817 trillion Btu
The energy consumption in the U.S. manufacturing sector in 2010, down 17 percent from the 22,576 trillion Btu (British thermal units) consumed in 2002.

-32%
The drop in the consumption of coal in the U.S. manufacturing sector from 2002 to 2010, going from 1,956 trillion Btu in 2002 down to 1,328 trillion Btu consumed in 2010.

Source: U.S. Energy Information Administration, 2010 Manufacturing Energy Consumption Survey


Building a House

2,598 square feet
The average size of a single-family home completed in 2013; 59,000 had two or fewer bedrooms and 251,000 had four bedrooms or more.

$324,500
The average sales price of a new single-family home sold in 2013. In 2012, the average sales price of a single-family home sold was $292,200.

10,000
The number of multifamily buildings built across the U.S. in 2013. Of these, 6,000 used electricity as the primary heating fuel.

Source: 2013 Characteristics of New Housing


Reduce, Reuse, Recycle

19.8%
Increase in the number of recyclable material merchant wholesalers (NAICS 423930) establishments across the U.S. in 2012, from 7,377 establishments in 2007 to 8,838 establishments in 2012.


116,229
Number of employees working for recyclable material merchant wholesalers (NAICS 423930) in 2012, up 11.0 percent from 104,671 employees in 2007.

$93.5 billion
Sales for recyclable material merchant wholesalers (NAICS 423930) in 2012, up 16.7 percent from $80.1 billion in 2007. 2012 sales for recyclable paper and paperboard products: $9.8 billion. 2012 sales for recyclable plastics products: $2.3 billion.  2012 sales for recyclable glass products: $0.6 billion.

Source: U.S. Census Bureau, 2012 Economic Census and 2007 Economic Census

$8.4 billion
Product shipments value for recycled paperboard in 2013.

Source: U.S. Census Bureau, 2013 Annual Survey of Manufactures


Collecting Revenue

$1.5 billion
Estimated revenue for “waste collection – hazardous waste management collection services” in 2013 for estimated sources of revenue for U.S. employer firms. This was up 16.4 percent from 2012.

$6.6 billion
Estimated revenue for “waste treatment and disposal – hazardous waste treatment and disposal services” in 2013 for estimated sources of revenue for U.S. employer firms. This was up 5.6 percent from 2012.

$12.9 billion
Estimated revenue for “local, fixed-route passenger transportation, by road and transit rail” in 2013 for estimated sources of revenue for employer firms. This is up 5.2 percent from 2012.

Source: 2013 Service Annual Survey, Table 4

Regional Homeowners and Their Mortgage Status (2013)

According to the data from the ACS for our regional PUMA (basically all of both counties minus the southern most towns), slightly more than half of all home owners still have outstanding balances on either their mortgage or on home equity loans. Of course that also means that 48% have no outstanding balance and own their homes free and clear.


Tuesday, April 21, 2015

Worker Status: Full-Time and Part-Time Workers in Families

Two parent working families are something we often read about, but rarely see data on. The PUMS data for our region provides some insight into full-time as well as part-time workers in families.

The graph below shows the prominence of full-time workers, part-time workers, and no workers for families with two parents present, as well as single parent families.  Almost three out of four two parent families (72.4%) have at least one full time worker present. However, only 40% of two parent or married couple families are lucky enough to have BOTH parents working full time jobs. In addition, as many as a quarter of two parent families (26%) only have a single full time worker, where the spouse has no employment.

When looking at working fathers, as many as 62% have a full time job, compared to only 45.5% of working mothers. While slightly more than a quarter of single fathers and mothers work only part-time positions (27.3% and 28.4% respectively), single mothers are fair more likely to be unemployed (26.0%) compared to single fathers (10.7%).

Please note: Any household with someone age 65 or older present was excluded in order to not inflate the number/percentage of families where the householder is a retiree and not working. Hopefully the targeted families examined here are thereby headed largely by working age householders between the ages of 16 and 64.

CLICK TO ENLARGE

Tuesday, April 14, 2015

Home Ownership Turnover: Percent of Owner Occupied Homes With New Owners Since the Year 2000

The map below is based on the 2013 ACS Block Group data for the region. It represents the percent of owner occupied homes that have new owners since the year 2000 for each block group in the region.

Block groups are simply smaller parts of census tracts. These block groups are broken into those where half or more of the homes have changed hands, 40 to 49 percent have new owners, 30 to 39 percent are now owned by someone other than who owned them in the year 2000, and those where less than 30% have changed owners. Basically this is from the most active area of turnover to the least active area of turnover.

Also note: the green areas are block groups with fewer than 50 owner occupied homes present. For statistical purposes, they were excluded from the review of change in ownership due to the small number of homes in those areas.

Click to enlarge the map !

Click to Enlarge

Wednesday, April 8, 2015

Stay Connected II: How We Compare to the Rest of Upstate New York

Yesterday I posted some internet related data for our two county region from the single year 2013 ACS estimates. Today, I turn to the Public Use Microdata (PUMs) to take a bit deeper look at our region as it compares to the rest of upstate New York.

For purposes here, two PUMAs (Public Use Microdata Areas - the geography underlying the PUMS data) cover 80% of the combined Herkimer- Oneida region. All but the southern most towns in both counties are included in this loosely defined geographical "region". That regional data was then compared to the rest of "Upstate New York" - namely all of the rest of New York except for the city of New York and Long Island. Because these are accessed on the basis of PUMAs, don't be disturbed if these numbers are slightly different from yesterday's - with different geographies come different statistics!

Below are several graphics showing how we compare regionally to the rest of Upstate New York. These are based on the single year ACS PUMs estimates for 2013.

To begin with, almost all of the upstate area, including our region, has some sort of telephone coverage, be it a landline at home, or cell service.


Many of us use mobile broadband services, especially for our "smart" phones. The percentage, however, may not be as large as you might think, and is less than the percentage of households in other parts of upstate New York.


In terms of subscribing to an internet service provider, our region slightly trails the rest of the upstate area.


When it comes to the type of subscription services we used for internet access, cable modem access dominates across the state, but especially in our region.

CLICK TO ENLARGE


Some households, however, remain without internet access. Slightly more households in our region lack access than in the rest of the upstate NY area.


And when it comes to staying connected, we have all the typical computer related devices available: laptops, desktops, tablets and cell phones. Generally speaking, fewer households in our region own these devices than do the households in the rest of upstate New York.

CLICK TO ENLARGE

Tuesday, April 7, 2015

Staying Connected: Computers and Regional Access To the Internet

One of the new areas included in recent American Community Surveys are questions on accessing the internet, as well as the availability of home computers and mobile devices. Below are several graphics from the Utica-Rome Region (Herkimer and Oneida Counties combined) which begin to explore some of this new found data !


Overall Internet Usage


Subscription Service Access

CLICK TO ENLARGE


Internet Access by Income

CLICK TO ENLARGE


Computers Presence and Internet Access

CLICK TO ENLARGE