Showing posts sorted by relevance for query food insecurity. Sort by date Show all posts

Tuesday, September 10, 2013

The Relationship Between Food Insecurity and Obesity Rates

A recent release by Child Trends on food insecurity and obesity shows a link between a lack of food and increases in body mass index, especially among children. As they observe, "Ironically, child food-insecurity is also associated with a greater risk for being overweight. While the processes underlying this association are not completely understood, food insecurity can result in lower diet quality and less variety, both of which can contribute to being overweight, and unpredictable availability of food can lead to overeating."

They go on to point out that in 2011, 22 percent of children under 18 lived in food-insecure households, and one percent in households with very low food security among children specifically. To learn more about food insecurity in our region visit this previous post about food insecurity in Herkimer and Oneida Counties.

Below are the most recent statistics from the New York State Health Department on obesity rates for New York State as a whole, for the upstate (non-New York City) region, for Herkimer County, and for Oneida County. Click on any of them to enlarge them.


Ironically, child food-insecurity is also associated with a greater risk for being overweight. - See more at: http://www.childtrends.org/?indicators=food-insecurity&utm_source=E-News%3AObesity+Month+and+Kids+without+Food&utm_campaign=E-News+9+5+13&utm_medium=email#sthash.g2ll0CmT.dpuf
Click to Enlarge NYS Data
Click to Enlarge Upstate Data
Click to Enlarge HC Data
Click to Enlarge OC Data

Wednesday, November 18, 2015

Herkimer County Food Insecurity 2009 to 2013

Back in 2013 I posted information about food insecurity. Food insecurity refers to the USDA's measure of the lack of access, at times, to enough food for an active, healthy life for all household members and limited or uncertain availability of nutritionally adequate foods. Food insecure households are not necessarily food insecure all the time. Food insecurity may reflect a household’s need to make trade-offs between important basic needs, such as housing or medical bills, and purchasing nutritionally adequate foods.

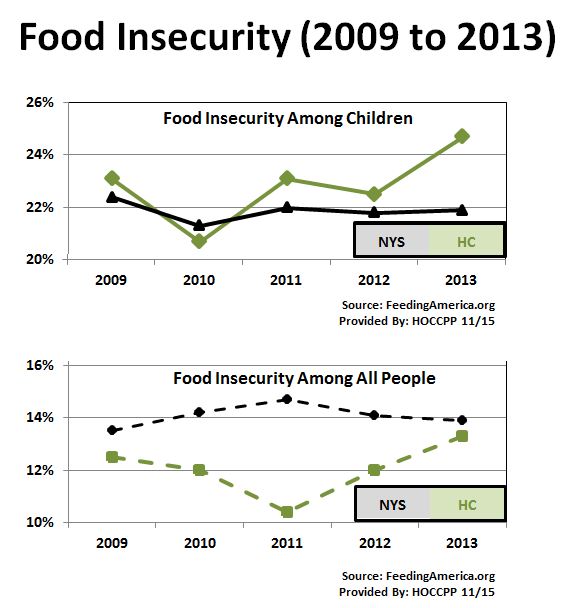
Since that post there is more information available from Feeding America that shows how the counties in the country have changed since 2009 through 2013. The food insecurity data is shown for two groups - the population as a whole, and the population of children for an area.

Below is a chart showing the data for Herkimer County as compared to New York State for that period of time. Note that food insecurity has remained relatively stable for children in NY, but seems to be climbing for children in Herkimer County. In terms of the overall population there is a small increase since 2009 for New York, while food insecurity for the total population of Herkimer County at first plummeted then rose between 2009 and 2013.


To see information for your area, please visit Feeding America and click on your county to get data similar to what is shown below (click to enlarge it).

CLICK TO ENLARGE

Friday, May 3, 2013

Understanding Food Insecurity In Our Region


In order to address the problem of hunger, we must first understand it. Feeding America undertook the Map the Meal Gap project to learn more about the face of hunger at the local community level. By understanding the population in need, communities can better identify strategies for reaching the people who most need food assistance.

Food insecurity refers to the USDA's measure of the lack of access, at times, to enough food for an active, healthy life for all household members and limited or uncertain availability of nutritionally adequate foods. Food insecure households are not necessarily food insecure all the time. Food insecurity may reflect a household’s need to make trade-offs between important basic needs, such as housing or medical bills, and purchasing nutritionally adequate foods.

You can select New York State and then the county of your choice from the interactive map at http://feedingamerica.org/hunger-in-america/hunger-studies/map-the-meal-gap.aspx and learn more about what our communities are facing when it comes to food insecurity. Once you get to the map, if you select the “Print” option (the yellow-orange box slightly above and to the right of the map), you can then specify what county or state you’d like data concerning.

But first a few words about the data sheets. Quite frankly they are a bit confusing to read. They provide some very interesting data but here’s a couple tips to help you understand their print out. First off, the top half of the page is New York State data; the bottom half is data for the county you selected.  Second, the data on the right hand side of the page, which is presented as a three-tiered green-shaded table of “Income Bands,” basically represents three different income groups – those who make more than 185% of poverty, those that make between 185% and 130% of poverty, and those that make less than 130% of poverty. Each one has different social safety nets that help people within the band. These are explained briefly below to help you understand what you are seeing when you look at the Herkimer and Oneida Counties data.

Click to Enlarge

Click to Enlarge
Click to Enlarge


Assuming that you can now follow what each of the "income bands" represents, the important number is the percentage shown for each of the bands. That percentage represents the percent of the food insecure population that falls into each income band. This allows you to not only see those that are the poorest among the local population that are struggle with food security, but also those that are sometimes referred to as the "working poor", those that may have jobs but still struggle to make ends meet.


At any rate, below you can find two sets of reports for each county. The firs set is for the county as a whole; the second set shows the data in regard to children within food insecure households. For a fuller explanation of these pages you may want to read some of the the Executive Summary of the "Map the Meal" page.


Click to Enlarge Herkimer County Full Report


Click to Enlarge Oneida County Full Report


And here are the two focusing on children in each county living within insecure food households.

Herkimer County Children Living with Food Insecurity


Oneida County Children Living with Food Insecurity