Wednesday, December 24, 2014

We're Number 4 ! We're Number 4 ! We're Number 4 !

Apparently we've already gotten coal in our stocking...


By adding an average of 803 new residents each day between July 1, 2013 and July 1, 2014, Florida passed New York to become the nation’s third most populous state, according to U.S. Census Bureau state population estimates released yesterday. Florida’s population grew by 293,000 over this period, reaching 19.9 million. The population of New York increased by 51,000 to 19.7 million.


California remained the nation’s most populous state in 2014, with 38.8 million residents, followed by Texas, at 27.0 million. Although the list of the 10 most populous states overall was unchanged, two other states did change positions, as North Carolina moved past Michigan to take the ninth spot.

Click to Enlarge

Tuesday, December 23, 2014

Herkimer County Households Without a Vehicle Available and Elderly Heads of Households

The map below comes from the 2013 ACS Five Year Estimates for Herkimer County and shows the block groups in which at least 10% or more of the households have no vehicle available. In addition, the hatched areas identify those same areas where 40% of more of these households lacking a vehicle are headed by someone age 65 or older.

So not only are the hatched areas block groups where a substantial part of the population lacks a vehicle, those that DO lack transportation are often elderly.


Just an example of what is out there in the five year estimates if you look hard enough ! For a closer look click the map below !

Click to Enlarge

Wednesday, December 17, 2014

Village of Bridgewater To Dissolve on Jan 1, 2015 But It Could Still Remain a Census Geography

While the Village of Bridgewater voted to dissolve itself on Jan 1, 2015, that doesn't mean it has to disappear completely. While the nearly 200 year old village will no longer be an incorporated village, it could still become a Census Designated Place.

Census Designated Places (CDPs) are the statistical counterparts of incorporated villages, and are delineated to provide data for settled concentrations of population that are identifiable by name but are not legally incorporated under the laws of the state in which they are located. The boundaries of CDPs usually are defined in cooperation with local officials and generally updated prior to each decennial census. These boundaries, which usually coincide with visible features, have no legal status and may change from one decennial census to the next. There are no population size requirements for CDPs.

So possibly by the next census (2020) a CDP covering the area formerly known as the Village of Bridgewater could be in place, in order to still provide statistical data about that "settled concentration of population".

The village may dissolve but data on that area can continue to be collected and reported if it were to be designated as a CDP!

Tuesday, December 16, 2014

Matrix of ACS Tables for Herkimer and Oneida County Profiles

There is a link under the main banner that will take you anytime to the matrix of ACS profile tables for Herkimer and Oneida Counties. These matrices provide you with access to the five and three year demographic, social, economic and housing profile for both counties, as well as the same single year profiles for Oneida County. Simply click the link above to take you to this permanent set of tables.


Please remember that if your intent is to compare different years of ACS data, that you should:

  • only compare like versions to like versions (one year estimates to one year estimates)
  • only compare discrete sets to one another (sets that do not have over lapping years, such as the 2012-2010 three year estimate to the three year estimate covering 2009-2007 since none of the years between the two overlap).
These matrices will continue to be updated as new ACS data profiles emerge each year !

Monday, December 15, 2014

Herkimer County Poverty Measures By Municipality (2013)

The 2013 ACS Five Year Estimates also provide poverty data, which many agencies use for grant writing and program preparation. The table below contains several age based poverty measures for every level of municipality in Herkimer County, including cities, towns, villages and census designated places. In addition, each of the towns where villages are incorporated are also shown without the village populations - note the towns where the name is followed by "(minus villages)". The ability to pull the village populations out of the towns allows for a closer look at our rural areas and their needs when it comes to poverty.

The age groups include: those under age 5; those under age 18, and those age 65 or older. Click on the table to enlarge it.

Herkimer County Poverty Measures (2013)

Click to Enlarge


Thursday, December 11, 2014

2013 Income Measures for Herkimer County Municipalities

With the release of the 2013 American Community Survey Five Year Estimates by the Census Bureau, data on commonly sought fields like income measures become more readily available. The data, which is collected over a five year period from 2009 to 2013, is available for small geographies, including municipalities and census designated places.

The table below shows three income measures for Herkimer County and its municipalities. They include: median household income (MHI); median family income (MFI); and the per capita income (PCI). Note that some of the data is shaded on the table. Because the data comes with margins of error, it is possible to assess whether the MHI, MFI and PCI figures are significantly different for each municipality compared to the County as a whole.

Green shaded cells mean that the figure is significantly higher than the county number. Pink shaded figures show that the data is significantly below the county medians, etc. Remember, the determination as to whether the value is significantly different is based on the margins of error, NOT on whether the median income measure is simply above or below the corresponding county figure.

One last note: town data is shown minus any villages contained within their boundaries. This provides more insight into the incomes of those choosing to live in more rural settings without the amenities that typically might come with village life. It also makes it easier to compare the incomes of those that live somewhere like the town of Stark, which contains no villages, with those that live in the town of Newport, which has three villages within its borders.

Herkimer County Income Measures (2013)


Tuesday, December 9, 2014

Herkimer County Areas With Significantly Higher or Lower Median Household Incomes

With the release of the 2013 ACS Five Year Estimates, a variety of data can now be looked at in terms of smaller geographies. This includes villages and towns. But even smaller census areas, like block groups, also have data available for review through the American Fact Finder on Census.gov. This is the first time that data on census block groups has been made available through the AFF.

Below is an example of what data is now out there for small geographies. It is a map showing the block groups for Herkimer County, highlighting those that have significantly higher or lower median household incomes when compared to the county as a whole. Note that some of the areas are hatched - this is done in order to let the viewer know that the margin of error for that particular small area is quite high (generally higher than 30% of the estimate). When margins of error are high for an estimate, it is important to view that data with some caution. It doesn't mean you should discount the information, but you need to view it as being statistically, well, fuzzy at best !

Click on the map to enlarge it.

Click to Enlarge

National Data on Workplace Injuries and Illnesses (2013)

Last week, the Bureau of Labor Statistics (BLS) released a report on workplace injuries and illnesses. As they stated: "Slightly more than 3.0 million nonfatal workplace injuries and illnesses were reported by private industry employers in 2013, resulting in an incidence rate of 3.3 cases per 100 equivalent full-time workers, according to estimates from the Survey of Occupational Injuries and Illnesses (SOII) conducted by the U.S. Bureau of Labor Statistics. The rate reported for 2013 continues the pattern of statistically significant declines that, with the exception of 2012, occurred annually for the last 11 years.

Click to Enlarge
 To read the entire report, visit this link at BLS.

Thursday, December 4, 2014

New FIVE YEAR ESTIMATES Available !

New five year estimates have been released from the Census Bureau as part of the American Communities Survey. These now cover a sample drawn from the 2009 to 2013 span and provide data for EVERY LEVEL OF GEOGRAPHY in both Herkimer and Oneida Counties !

To see the county level data, visit this link to a post on the blog or else click on the link under the banner at the top of the page to see the most recent five year estimates !

If you'd like to see a full matrix of the ACS One, Three and Five Year Estimates, visit this table, which is also listed under the banner at the top of the page.

Wednesday, December 3, 2014

School District Populations, Housing Units and Land Areas Exisiting in Herkimer County

Recently the Cornell Program on Applied Demographics got a request concerning the percent of a school district's population that resided in one county versus another - the district straddled two counties. Rather than just provide data for the single school district, they broke out the data for all school districts in New York.

Below are the district breakouts for Herkimer County. These include information on the district's population, housing units, and land area, as it relates to those people within the boundary of the district living in Herkimer County.

One thing to note - this is based on 2010 Census data, so districts that have merged since then are still listed by their old names !

Click to Enlarge

Tuesday, December 2, 2014

Herkimer County Prenatal Needs Assessment

Herkimer County HealthNet, Inc. recently released a comprehensive needs assessment for prenatal care services provided to women living in Herkimer County. This report represents the summary and findings of 20 key informant interviews, pertinent Herkimer population data, and recommendations to form a comprehensive needs assessment for prenatal services.

Herkimer County women currently receive obstetrics and gynecology services mainly at Faxton-St. Luke’s Healthcare and at Mary Imogene Bassett Hospital. the figure below shows the distribution of services by site of the provider. Please note that this distribution is not specific to obstetrical care, but also includes gynecology services.

Click to Enlarge

Among the main findings of the report were:

  • Access to prenatal services provided in Herkimer County has eroded to the point of almost being eliminated over the past decade. Little Falls Hospital closed its obstetrics service; Mohawk Hudson Planned Parenthood closed its office; the County Health Department closed the Prenatal Clinic; prenatalsupport services were decreased; and other providers decreased hours or limited service delivery in Herkimer County.
  • The birth rates in Herkimer County have been gradually decreasing between 2003 and 2012 with a difference of about 50 live births per year over the 10-year span.
  • One in every ten pregnancies in Herkimer County is a teenage pregnancy.Teen behaviors with regards to sexual behavior and condom/birth control use are conducive to increasing this trend.
  •  Infant mortality rates are higher in Herkimer County than in New York State and New York State excluding New York City. There appears to be an increase in infant mortality beginning in 2008.
  • Maternal mortality rates in New York State are among the highest in the country. Although the numbers are small for Herkimer County, and therefore unstable, the maternal mortality rates are concerning.
  • Pregnant women in Herkimer County receive late or no prenatal care at higher percentages than both the New York State average and that of the State excluding New York City.
  • There are race/ethnicity disparities in New York State and in Herkimer County regarding early prenatal care.
To get more information about the assessment, contact them through their home page at: http://www.herkimerhealthnet.com/home.html .

Wednesday, November 26, 2014

2013 Regional Assessment of Child Care by Cooperative Extension

Not too long ago, the Cornell University Cooperative Extension Office of Oneida County's Child Care Council released a report of the state of child care in 2013 for the region. As they stated in their introduction:

We are pleased to provide you with a copy of the 2014 Child Care Needs Assessment containing data related to early care and learning services in Herkimer, Madison and Oneida Counties. You will find data outlining the supply and demand of regulated child care, cost of care, trend data, quality, follow up surveys and more. We utilized our own comprehensive database with all licensed and regulated child care programs and all the parents/caregivers who request information and referrals, data provided by our local Departments of Social Services, Census information, and data from Child Care Aware of America. It is our intent to offer this needs assessment to inform and guide our partners in community planning, while internally, we utilize the information to drive our own program planning and strategic development.

The graphs below illustrate the number of potential slots for each modality in...Herkimer County. Potential child care slots are based on the MAXIMUM number of slots a program is registered or licensed to serve, regardless of whether or not the slot is currently filled or vacant.

Click to Enlarge

Potential family/group child care slots reflect the Maximum Potential Slots as per the NYS Office of Children and Family Services Child Care Facility System. A family child care provider may care for two children under the age of two and six children ages two to twelve. Group family child care providers, who have an assistant, may care for up to four children under the age of two and twelve children ages two to twelve. The following charts reflect an estimated number of available slots based
upon the number of family/group family providers in each county. Maximum capacity is determined by the number of caregivers per setting and the square footage per child.


Click to Enlarge

Lastly, the graphs located within this section indicate the number of potential child care slots for child care centers by age group (see appendix for information on age groups and staff-child ratios). As the graphs indicate, there is a significant lack of child care slots for infants and toddlers. Not every child care center provides care for these younger children.

Click to Enlarge

If you would like to get a copy of the Child Care Needs Assessment, you can contact them at 315-223-7850 or call them toll-free at 1-888-814-KIDS (5437).


October 2014 Labor Market Profile from DOL

Click to Enlarge

Tuesday, November 25, 2014

NYS Unemployment Rates By Counties (September 2014)

Click to Enlarge
Source: NYS DOL (11/2014)

2013 Five Year Estimates to Be Released Next Thursday (12/4)

The 2013 Five Year Estimates of the American Communities Survey will be released next Thursday, providing data for basically all small areas (block groups and tracts) as well as municipalities (regardless of population size). The data will come from a sample collected across the years 2009 to 2013. I will post the basic profiles as soon as I can get them uploaded as PDFs.

Monday, November 24, 2014

Small Business Saturday: November 29th


This Saturday, November 29th, will be the fifth anniversary of the kickoff of Small Business Saturday (SBS). SBS is a day to celebrate and support small businesses and all they do for our local communities. 

According to the Small Business Patterns 2012, about 2,100 Herkimer County residents are employed in retail settings, with a combined payroll of roughly $46 million dollars. Another 1,500 work in food services and accommodations, accounting for another $19.6 million in payroll. Around 90% of the retail, the food service and the accommodations establishments in Herkimer County have less than 20 employees! 


Thursday, October 23, 2014

Herkimer and Oneida Counties 2013 ACS Three Year Estimates Are Now Here!

Each year, the Census Bureau releases three versions of the American Communities Survey (ACS). These are the 1-Year, the 3-Year, and the 5-Year ACS Estimates. These are released based on the population size of the municipality. Five year estimates are released for EVERY level of census geography (down to the block group level) as well as every municipality (think town, city, and village). Three year estimates are only released for geographies or municipalities with a MINIMUM population of 20,000 persons. As a result, many smaller villages and towns are excluded. One year estimates are released for municipalities with a MINIMUM population of 65,000. This means they are mostly for counties and larger cities. For our region, only Oneida County and the Utica Rome MSA have single year estimates available.  

The newest Herkimer County ACS data comes through the Three Year ACS Estimates which are NOW AVAILABLE!  The most recent 3-Year Estimates are a permanent part of this blog in the linked area just below the title above. A permanent link will take you to the most recent 3 year estimates post so you can always easily find this important data for both counties !

Below are the individual links to the Demographic, Social, Economic and Housing Profiles for the 2013 Three Year ACS Estimates for Herkimer and Oneida Counties.


2013 OC ACS 3 Year Estimate Demographic Profile
2013 OC ACS 3 Year Estimate Social Profile
2013 OC ACS 3 Year Estimate Economic Profile
2013 OC ACS 3 Year Estimate Housing Profile


2013 HC ACS 3 Year Estimate Demographic Profile
2013 HC ACS 3 Year Estimate Social Profile
2013 HC ACS 3 Year Estimate Economic Profile
2013 HC ACS 3 Year Estimate Housing Profile

Friday, October 17, 2014

Weekly Hours Worked and Weeks Worked Per Year By "For Profit", "Non-Profit", "Government" and "Self Employed" Workers

Now that summer vacation has come and gone and we head into winter, I thought it would be interesting to look at the weeks worked each year and the hours worked per week by various parts of the workforce. Specifically I used the 2012 ACS Five Year Estimates PUMS data "Class of Worker" typography to compare those that work in "for profit" businesses, those in "not for profits", those in "government employment" and those that are "self employed".

Below are several graphs which show the distribution of each of these classifications in terms of the hours and weeks worked in the past year. To start with, as you can see below, most of the workforce is working between 31 to 40 hours weekly - the majority of those working at for profit businesses (56%), those in non-profits (55%), and those working in the public sector/government (62%) all work in the 31 to 40 hour range.

Click to Add

The lone exception are workers who are self employed. While more of them work 31 to 40 hours per week (26%) than any other ten hour span, it is not a number approaching the 50% mark as with the other three workforce groups. If we look a bit deep at these numbers the reason why is obvious.

Below are four pie charts showing the percent of workforce for each group that work more than 40 hours per week. In the case of for profits, non-profits, and government workers, somewhere between 38% and 45% worked in excess of 40 hours each week in the past year. However, note the percent of self employed workers who put in more than 40 hours of work each week - nearly 3 in 4 (74%) worked in excess of 40 hours per week. And from the PUMS data, it shows that as many as 15% worked in excess of 50 hours each week!


Click to Enlarge


Add caption

Not surprisingly, most of the workforce works 50 or more weeks per year - regardless of the sector, between 70% and 75% worked 50 to 52 weeks in the last year.

Click to Enlarge

Here is the distribution of each group's workforce in regard to the number of weeks less than 50 that they worked in the prior year.

Click to Enlarge

How The Census Bureau Measures Poverty

The US Census Bureau offers two measures of poverty. The official measure of poverty is the more traditional piece based on a 1963 definition of poverty living based largely on cash resource availability. The second measure is the Supplemental Poverty Measure (SPM) which accounts for non-cash benefits from government programs aimed at low income families as well as cash resources of the household.

Below is an infographic comparing the two measures which helps explain their differences more fully. A publication by the Census Bureau, located here, provides some comparisons between the official and SPM data by state. To see local information for your community on poverty, visit this previous post of poverty and income by municipality.


how census measures poverty infographic image [Source: U.S. Census Bureau]

Tuesday, October 14, 2014

A Look at Seniors in Herkimer County From the 2012 ACS Five Year Estimates

Below are two tables showing characteristics of the current population age 65 and over in Herkimer County. New data for Herkimer County will be available at the end of this month in the form of the 2013 ACS Three Year Estimates!

Herkimer County Elderly Profile (Part 1)

Click to Enlarge Part 1


Herkimer County Elderly Profile (Part 2)

Click to Enlarge Part 2

Monday, October 13, 2014

New Zip Code Data from the IRS

The IRS recently released ZIP Code data showing selected income and tax items classified by State, ZIP Code, and size of adjusted gross income. These data are based on individual income tax returns filed with the IRS and are available for Tax Years 1998, 2001, 2004 through 2012.
 
The map on the IRS page allows you to select a set of state ZIP Codes and peruse their data. 
 
 
The data include items such as:
  • Number of returns, which approximates the number of households
  • Number of personal exemptions, which approximates the population
  • Adjusted gross income 
  • Wages and salaries
  • Dividends before exclusion
  • Interest received  

So pick a year below and take a look at your local ZIP code !
ZIP Code Data
ZIP Code Data 1998–2010
1998  2001  2004  2005  2006  2007  2008  2009  2010

Tuesday, October 7, 2014

An Example of Using ACS Estimates Over Time: Poverty and Family Types 2005 to 2013

As the single year (and the three year) American Community Survey (ACS) data continues to be released, it is important to remember that data now exists going back to 2005 for our area. One of the hopes of the Census Bureau was that such data availability would allow policymakers, as well as the public, the opportunity to look at their region longitudinally, albeit with a certain amount of caution.

As an example, below are the historical estimates of poverty by family type, in this case single mom families versus two parent families in Oneida County. Not surprisingly, poverty rates for single parents are quite a bit higher than they are for dual parent families - the average over the nine years is about 30% for single moms and around 5.5% for dual parent families.

Click to Enlarge


What's important to note is the trends depicted by the shaded areas in the chart, which represent the margins of error for each year. As can been seen, they are rather large for single moms and fairly small for dual parents. This is mainly because of the small number of single mom's sampled (due to their fairly small number within the community). Just be sure to take a look at those margins of error as you explore the ACS data as there are times that they are exceedingly large, and should then be viewed with a some caution.

Thursday, October 2, 2014

Does Buying Local REALLY Matter?

A post at Demo Memo, a great site analyzing demographics data, looked at the issue of local businesses and the impact "buying local" has. As they asked the question, "Does buying local matter to economic well being?"

What they found was that this question is addressed in a Federal Reserve Bank of Atlanta analysis  of county level economic data for the 2000 to 2009 time period. Economist Anil Rupasingha examines the local share of employment by county and compares those numbers to real per capita income growth, employment growth, and poverty.

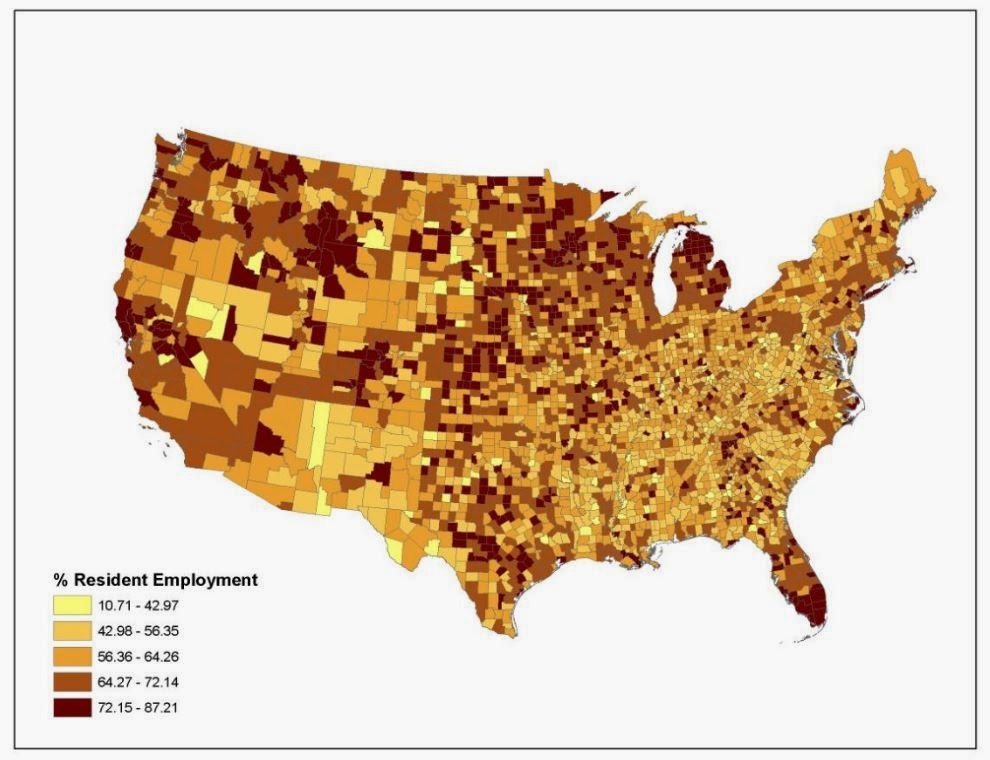
In most counties, employment in locally-owned businesses surpasses employment in "nonresident-owned" businesses. But the local share varies greatly by county, which you can see at a glance in the county-level maps included in the analysis. The share of employment in locally-owned businesses varies by county from 11 to 87 percent. The share of employment in nonresident-owned businesses varies by county from zero to 85 percent.

Percent of Residents Working in Locally Owned Businesses (2007)


Click to Enlarge


"Historically, the most popular local economic development approach was to attract businesses outside a particular municipality, state, or region," says Rupasingha. But theories about local economic development are changing, he says, and "economic development based on local entrepreneurship is increasingly gaining traction." Which approach is better?

Local is better. According to the study's results, the greater the local entrepreneurship, the greater the per capita income and employment growth and the lower the poverty. Also and interestingly, smaller local businesses have a greater effect on local economic performance than larger local businesses. "My results suggest that fostering smaller local businesses may be good local economic development policy," Rupasingha concludes.

Locally, businesses with less than 50 employees make up about 98% of companies in Herkimer county and 95% of those in Oneida County. There are more than 10,000 people who consider themselves "self employed" in the region ! So obviously small businesses play a big part of our local economy.