Showing posts with label ancestry. Show all posts

Wednesday, December 2, 2015

The Local Growth of "American" as an Ancestral Choice in the ACS

I think this is interesting to see how the regional response to the question of ancestry has changed over time when looking at those that identified as having a single ancestry - "American". While we used to be similar to the rest of the state and country, in the last five years we have seen a huge rise regionally in the percent of people who now say that they are simply "American" when asked about their ancestral past.

Click to enlarge the graph...


CLICK TO ENLARGE

Friday, July 17, 2015

And Finally Small Ethnic Populations Around Oneida County

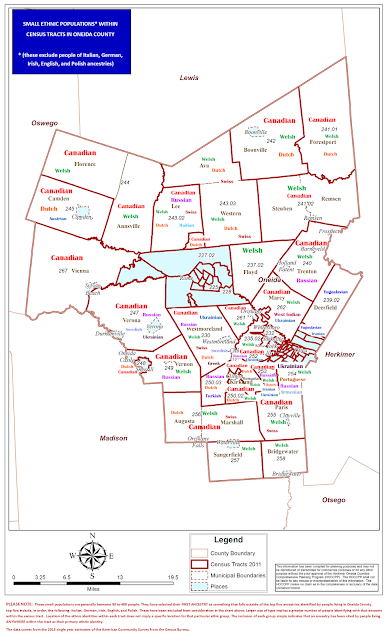
I have been posting tract level maps of the region showing their small ethnic populations - these exclude the big five: Italian, German, English, Polish and Irish. Around 80% of people living in Oneida County identify themselves as being either Irish, Italian, German, Polish or English.

Instead these are the next most popular ethnicities/ancestries identified by people within each census tract. Generally speaking these are very small groups of people - typically somewhere between 50 and 500 people. So these ethnicities or ancestries identified on the maps below are small pockets of of people who maintain an identification with less familiar backgrounds.

When looking at the maps beware of a couple of things. The exact locations of the people claiming to be "Canadian" in a tract, for example, is unknown. The placement of the label is purely a matter of convenience, not an indication of where any group specifically lives. Second, the size of the type is used to suggest the relative size of the populations in each group. Larger type size equals more people.

So take a look at your area, r4ecognize that most of the people that live there are probably one of the Big Five (Italian, Irish, German, Polish or English), but that there are other groups living in your community who may have a considerably different background than you have ! Click to enlarge the map.

CLICK TO ENLARGE

Thursday, July 16, 2015

Rome Small Ethnic Populations By Tracts

Recently I posted about small ethnic populations in Herkimer County and in the City of Utica. Here now is a similar look at the same issue in Rome.

These are not the major ethnic groups that dominate the county population. Around 80% of people living in Oneida County identify themselves as being either Irish, Italian, German, Polish or English. Instead these are the next most popular ethnicities/ancestries identified by people within each census tract. Generally speaking these are very small groups of people - typically somewhere between 50 and 2500 people. So these ethnicities or ancestries identified on the maps below are small pockets of of people who maintain an identification with less familiar backgrounds.

When looking at the maps beware of a couple of things. The exact locations of the people claiming to be "Canadian" in a tract, for example, is unknown. The placement of the label is purely a matter of convenience, not an indication of where any group specifically lives. Second, the size of the type is used to suggest the relative size of the populations in each group. Larger type size equals more people.

So take a look at your area, r4ecognize that most of the people that live there are probably one of the Big Five (Italian, Irish, German, Polish or English), but that there are other groups living in your community who may have a considerably different background than you have ! Click to enlarge the map.

CLICK TO ENLARGE

Tuesday, July 14, 2015

Small Ethnic Populations in Utica and the Surrounding Area

Below is a map of Greater Utica area. the map is laid out to help identify small ethnic populations within census tracts within the City of Utica. These are not the major ethnic groups that dominate the county population. Around 80% of people living in Oneida County identify themselves as being either Irish, Italian, German, Polish or English.

Instead these are the next most popular ethnicities/ancestries identified by people within each census tract. Generally speaking these are very small groups of people - typically somewhere between 50 and 2500 people. So these ethnicities or ancestries identified on the maps below are small pockets of of people who maintain an identification with less familiar backgrounds.

When looking at the maps beware of a couple of things. The exact locations of the people claiming to be "Canadian" in a tract, for example, is unknown. The placement of the label is purely a matter of convenience, not an indication of where any group specifically lives. Second, the size of the type is used to suggest the relative size of the populations in each group. Larger type size equals more people.

So take a look at your area, r4ecognize that most of the people that live there are probably one of the Big Five (Italian, Irish, German, Polish or English), but that there are other groups living in your community who may have a considerably different background than you have ! Click to enlarge the map.

CLICK TO ENLARGE

Monday, July 13, 2015

Small Ethnic Populations By Census Tracts In Herkimer

Below are two maps of Herkimer County. Each helps identify small ethnic populations within census tracts within the census tracts of the county. These are not the major ethnic groups that dominate the county population. Around 80% of people living in Herkimer County identify themselves as being either Irish, Italian, German, Polish or English.

Instead these are the next most popular ethnicities/ancestries identified by people within each census tract. Generally speaking these are very small groups of people - typically somewhere between 50 and 350 people. So these ethnicities or ancestries identified on the maps below are small pockets of of people who maintain an identification with less familiar backgrounds.

When looking at the maps beware of a couple of things. The exact locations of the people claiming to be "Canadian" in a tract, for example, is unknown. The placement of the label is purely a matter of convenience, not an indication of where any group specifically lives. Second, the size of the type is used to suggest the relative size of the populations in each group. Larger type size equals more people.

So take a look at your area, r4ecognize that most of the people that live there are probably one of the Big Five (Italian, Irish, German, Polish or English), but that there are other groups living in your community who may have a considerably different background than you have !

County-wide Tracts

CLICK TO ENLARGE


Valley and Village Tracts

CLICK TO ENLARGE

Thursday, July 2, 2015

Five For the Fourth: The Top Five First Ancestries Cited in Each Municipality in Herkimer County

For this Fourth of July where we celebrate the melting pot that is our country, click on the table below to see the top five first ancestries cited by ACS respondents for each of the municipal areas of Herkimer County. Note within the town rankings where the town (with villages included) may have one set of top five ancestries, but when those villages are pulled out of the data, the remainder of the town might have a different leading ancestry !

Click on the table to enlarge it !

CLICK TO ENLARGE

Monday, March 16, 2015

A Touch O' The Green: Regional Irish Heritage

After looking at the decline of people born in Ireland who live among us regionally, there are many of us who either are, or who claim to be, of Irish heritage. According to the 2013 One Year Estimates of the American Communities Survey, more than 45,000 regional residents said that they were "Irish" when asked about their ancestry.

Below is a graph showing the number of residents in the Herkimer and Oneida County region combined that said they have Irish heritage in the ACS from 2005 to 2013. As you can see, it appears as though fewer people in the region have been identifying themselves as Irish for most of the last decade. Click to enlarge the graph.

CLICK TO ENLARGE

Friday, March 13, 2015

100 Year Look at the Regional Population Actually Born in Ireland

While many of us claim to have Irish heritage, if only for one day a year, there was a time when those actually born in Ireland numbered in the thousands in our region. The graphic below shows how that number has dwindled in the last 100 years, to barely one percent of what it had been a century earlier!

CLICK TO ENLARGE

Tuesday, May 28, 2013

Top Five Ancestries in Herkimer and Oneida Counties: 1980 to 2010

Ancestry is a relatively new question within the Census. The ancestry question was added to the census form in 1980, so the data concerning ancestry is about 30 years old at best. Ancestry can refer to a person’s ethnic origin or descent, their "roots" or heritage, or the place of birth of the person or the person’s parents or ancestors before their arrival in the United States. Some ethnic identities, such as "German" or "Jamaican," can be traced to geographic areas outside the United States, while other ethnicities such as "Pennsylvania Dutch" or "Cajun" evolved in the United States.Some obviously may refer to a specific country (Polish), while others may be more regional in concept (Arab).

The intent of the ancestry question is not to measure the degree of attachment a respondent has to a particular ethnicity. Rather it is intended to give people a chance to describe their self-identity with any particular heritage if they feel they have one. So, for example, a response of "Irish" might reflect total involvement in an "Irish" community. On the other hand it may reflect only a memory of ancestors several generations removed from the individual. A person’s ancestry is not necessarily the same as his or her place of birth; i.e., not all people of German ancestry were born in Germany (in fact, most were not).

And of course, some people prefer to identify their ancestry as American. This could be because their ancestors have been in United States for so long or they have such mixed backgrounds that they do not identify with any particular group. Some foreign born or children of the foreign born may report American to show that they are part of American society. There are many reasons people may report their ancestors as American, and the growth in this response has been substantial.

All that being said, so what do Herkimer and Oneida Counties ancestry data look like ? Well below you can see the Top Five Ancestries for each county since the question was introduced in 1980. Note how some ancestral  identities have declined while others have risen. And in Herkimer County, one ancestry dropped out of the Top 5 altogether.

Top Five Ancestries in Herkimer County

Herkimer County (Click to Enlarge)


Top Five Ancestries in Oneida County

Oneida County (Click to Enlarge)