When you click that link you end up here:
 |
| Click to Enlarge |
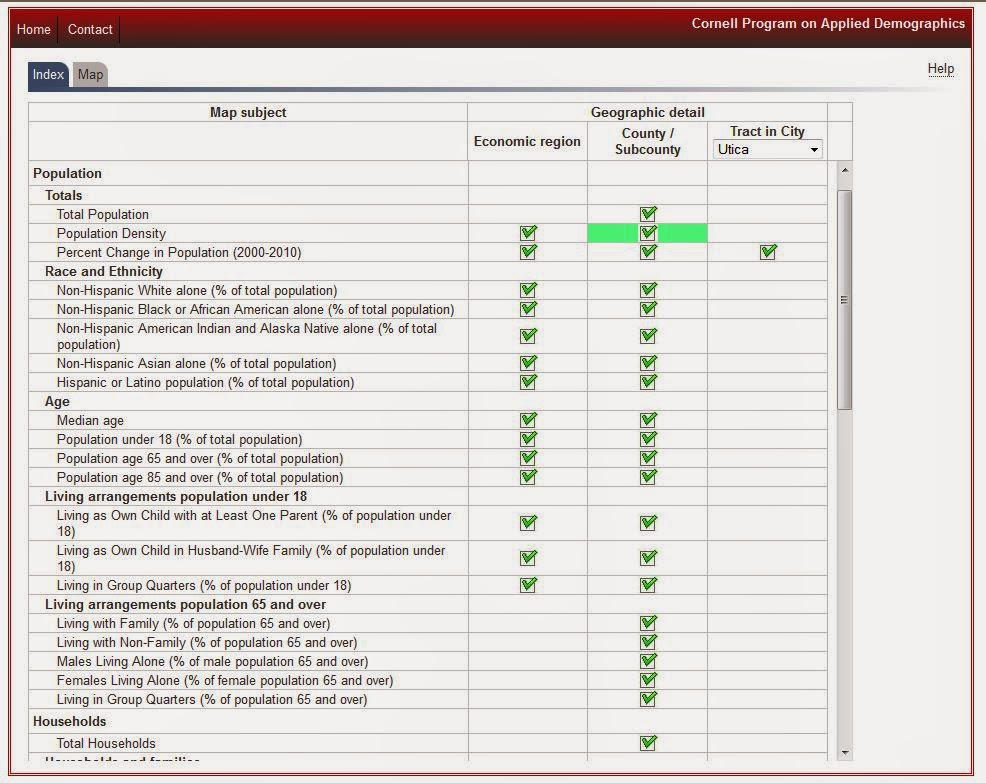
Note several things...first, each check box is a map. You can see them by either the economic region, the county/subdivisions, or by a specified city.

To see a map, simple click on the box under the geographic level you'd like to see mapped out. You end up with a map like the following, which shows population density.
 |
| Click to Enlarge |
To get back to the index page either use your back button or click the index tab at the top left.

There are a ton of maps here so take a look around and check the ones for the city of Utica as well!