Monday, February 22, 2016

Women Owned Businesses in the Region

Last week I posted about the region's minority owned businesses. Just like those data, data on women owned businesses can also be found in the 2012 Census of Business Owner, and specifically Table SB1200CSA01: Statistics for Firms by Industry, Gender, Ethnicity and Race. Below are just a few tidbits about female owned businesses in the Herkimer Oneida Counties region.


Friday, February 19, 2016

Regional Minority Owned Businesses from the 2012 Survey of Business Owners

The 2012 Census of Business Owners includes data on minority owned businesses. Table SB1200CSA01: Statistics for Firms by Industry, Gender, Ethnicity and Race, provide a plethora of data about these firms, some of which I have tried to capture below. Visit American Fact Finder at the Census Bureau and see what other data exists for these businesses !

The graphics below are based on regional data - meaning the two counties combined.


Thursday, February 18, 2016

Projected Openings in Occupations Within the Mohawk Valley: 2012 to 2022

A while ago I posted on job openings in the Mohawk Valley by occupation through 2020. Note that the "Mohawk Valley" includes Fulton, Herkimer, Montgomery, Oneida, Otsego, and Schoharie Counties combined. The information has been updated an is now available for the period 2012 to 2022.

There are several ways to look at this data. First, and similar to what I did the last time, you might take a look at the actual numbers of jobs being created. Job creation takes into account brand new jobs, as well as hirees selected to replace workers that have left or retired. The chart below shows the top 10 jobs with projected growth from 2012 to 2022 for the Mohawk Valley Region.

CLICK TO ENLARGE
As the data shows, the top growth is in Office and Administrative Support jobs. The vast majority of that projected growth involves openings created mostly by current job holders leaving those positions - 770 out of a projected 900 openings.  On the other hand nearly half of the growth in Personal Care and Service jobs come from new job creation (200 out of 410 job openings).

Another way to look at these job openings is by the percentage growth they are projected to have. It's one thing to see a projected increase of 900 jobs, but another if those 900 jobs represent only a small percentage of that particular market sector. So as an alternative way to view these projections, here are the top ten projected openings by their percentages of job sector.

CLICK TO ENLARGE
In this case you can now see how the sectors with the largest percentage projected growth is Personal Care and Service (17.6% projected growth), and Healthcare Practitioners and Technical Support (15.6% projected growth).

Lastly, here is a summation of all of the sectors, their job creation projections, and current salary data.

CLICK TO ENLARGE

Wednesday, February 17, 2016

Occupational Attractions: Who Marries Whom By Occupation


When it comes to falling in love, it’s not just fate that brings people together—sometimes it’s their jobs. Bloomberg.com scanned data from the U.S. Census Bureau’s 2014 American Community Survey—which covers 3.5 million households—to find out how people are pairing up by occupation.

Interestingly, here's how Urban Planners seem to match up. Click to Enlarge the graphic. Type your occupation into the space on the page to see how you might match up to your mate, job-wise. 


CLICK TO ENLARGE

Tuesday, February 16, 2016

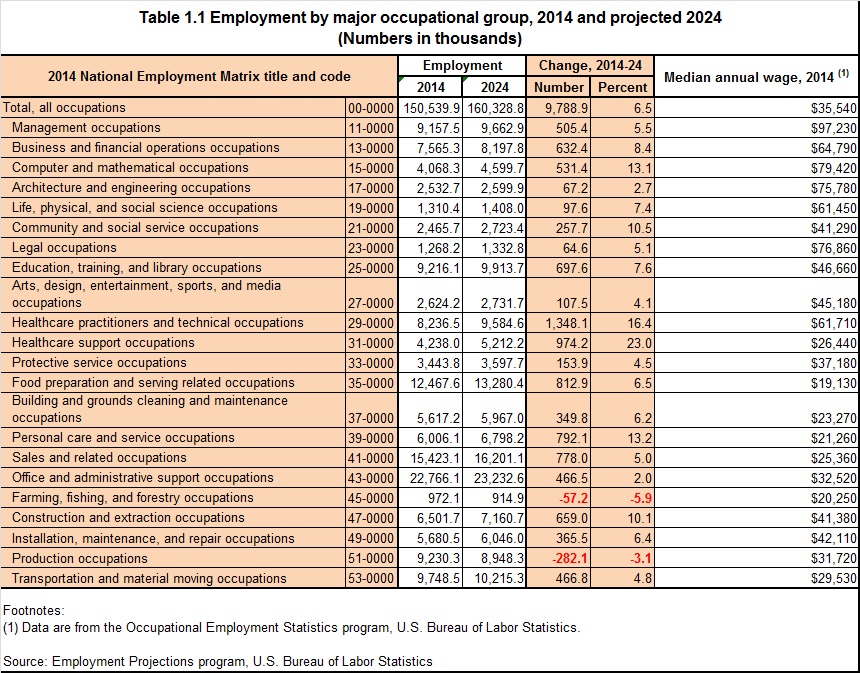
Projected National Job Growth By Occupation (2024)

From the Bureau of Labor Statistics comes projected job growth within various occupations through 2024. The data provides a comparison of 2014 occupational data with the projected changes by the year 2024.

Here are three basic tables found in the Excel spreadsheet download: overall employment by major occupational group; the fastest growing occupations; and the fastest declining occupations. Click each to see them enlarged.

CLICK TO ENLARGE


CLICK TO ENLARGE


CLICK TO ENLARGE