Wednesday, July 22, 2015

The Region's Young Workers: Aging and Retention Across Decades (1950-2010)

The graph below shows how each decade's cohort of workers age 20 to 29 have changed over the following decade. So for example, workers who were between 20 and 29 years of age in 1950 saw a growth of 9.2% in 1960, when they were then ages 30 to 39. Each decade's cohort of 20 to 29 year olds were compared to the subsequent decade's 30 to 39 year olds to see if they had gained or lost numbers.

Click the graph to enlarge it.

CLICK TO ENLARGE

Monday, July 20, 2015

Misusing The ACS: A Lesson in What NOT to Do


Recently an article appeared in the local paper citing a website created by the Economistsoutlook Blog which purports to compare recent gains in what they term "housing wealth", which is derived from rising home prices over the last several years. As the basis for their measurement they located, and compared, the FIVE YEAR ESTIMATES of the American Communities Survey from 2011 and 2013.


According to the local news article:
"Median home prices in the Utica zip codes of 13501 and 13502, increased from $91,500 to $94,800 and from $92,300 to $92,600 during the years examined, and saw housing wealth gains of $5,950 and $2,973 respectively.
The Herkimer zip code of 13350 saw the biggest housing wealth gain of $5,983 and also saw the largest jump in home prices – from $82,300 to $85,900."


The Economists Outlook use of the ACS data is TOTALLY WRONG BASED ON THE CENSUS RECOMMENDATIONS FOR USING THE ACS.

Here's just a few reasons why...

First, there is substantial overlap in the samples periods. The first period (the five year estimate for 2011) covers the following years: 2007, 2008, 2009, 2010, 2011 The second period (five year estimates for 2013) covers these years: 2009, 2010, 2011, 2012, 2013. Three out of five of these years are overlapping, a HUGE thing to avoid when comparing ACS estimates. 

Second, there is no mention of whether these differences are statistically significant or could be due to random variation. A simple comparison of the margins of error would tell you this, yet they fail to provide this information. So in fact, the small differences may be insignificant.

Third, the Census Bureau urges caution because of changes in the housing values provided by respondents from 2007 to 2008. Specifically they say that caution should be used when comparing ACS data on value from the years 2008 and after with pre-2008 ACS data. In 2007 and previous years, the ACS home value question included a series of categorical response options, and then a with a write-in for values over $250,000. Beginning in 2008, the response option became solely a write-in value for ALL homes. 

Fourth, it is important to realize that the value is the respondent's perception of what the house would sell for, and not an objective appraisal of fair market value. 

And finally there has been no adjustment for inflation between the vintage years of 2011 and 2013. In fact, many of the values cited may simply be functions of inflationary pressures, not a true increase in wealth.

In hindsight, it is important to recognize that the ACS can be tricky to deal with sometimes, and especially when it comes to comparing varying years. 

Friday, July 17, 2015

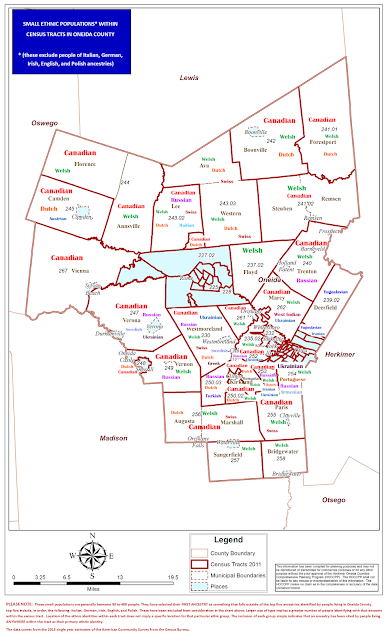
And Finally Small Ethnic Populations Around Oneida County

I have been posting tract level maps of the region showing their small ethnic populations - these exclude the big five: Italian, German, English, Polish and Irish. Around 80% of people living in Oneida County identify themselves as being either Irish, Italian, German, Polish or English.

Instead these are the next most popular ethnicities/ancestries identified by people within each census tract. Generally speaking these are very small groups of people - typically somewhere between 50 and 500 people. So these ethnicities or ancestries identified on the maps below are small pockets of of people who maintain an identification with less familiar backgrounds.

When looking at the maps beware of a couple of things. The exact locations of the people claiming to be "Canadian" in a tract, for example, is unknown. The placement of the label is purely a matter of convenience, not an indication of where any group specifically lives. Second, the size of the type is used to suggest the relative size of the populations in each group. Larger type size equals more people.

So take a look at your area, r4ecognize that most of the people that live there are probably one of the Big Five (Italian, Irish, German, Polish or English), but that there are other groups living in your community who may have a considerably different background than you have ! Click to enlarge the map.

CLICK TO ENLARGE

Thursday, July 16, 2015

Rome Small Ethnic Populations By Tracts

Recently I posted about small ethnic populations in Herkimer County and in the City of Utica. Here now is a similar look at the same issue in Rome.

These are not the major ethnic groups that dominate the county population. Around 80% of people living in Oneida County identify themselves as being either Irish, Italian, German, Polish or English. Instead these are the next most popular ethnicities/ancestries identified by people within each census tract. Generally speaking these are very small groups of people - typically somewhere between 50 and 2500 people. So these ethnicities or ancestries identified on the maps below are small pockets of of people who maintain an identification with less familiar backgrounds.

When looking at the maps beware of a couple of things. The exact locations of the people claiming to be "Canadian" in a tract, for example, is unknown. The placement of the label is purely a matter of convenience, not an indication of where any group specifically lives. Second, the size of the type is used to suggest the relative size of the populations in each group. Larger type size equals more people.

So take a look at your area, r4ecognize that most of the people that live there are probably one of the Big Five (Italian, Irish, German, Polish or English), but that there are other groups living in your community who may have a considerably different background than you have ! Click to enlarge the map.

CLICK TO ENLARGE

FREE Shuttle Service Now Available in Old Forge and Thendara

An exciting new free service is available in the Old Forge/ Thendara area. A looped transit service will be provided through the core of the Old Forge area. The service will be operated with two smaller, shuttle sized vehicles.

The Community Shuttle will travel from Hollister’s Trading Post/ VIEW on the north end of town to the Thendara Railroad Station/ Van Auken’s Inne on the south end of town. The Bear Route and Moose Route shuttles provide approxi-mately 15 stops throughout the town for easy on/off access at points of interest and are fully wheelchair and ADA accessible!

The Community Shuttle is operating as a two-year pilot program through utilization of Federal Rural Transit funding. The pilot has been made possible through the cooperation of Town of Webb and Herkimer County as the project sponsors. Local business contribution and community backing for this shuttle have made it possible; the support is unparalleled in other rural transit systems.

The Map below provides an idea of where the loops run. To get information about the schedule, etc., of this new service, visit Herkimer Oneida Counties Transportation Study website.

CLICK TO ENLARGE

Tuesday, July 14, 2015

Small Ethnic Populations in Utica and the Surrounding Area

Below is a map of Greater Utica area. the map is laid out to help identify small ethnic populations within census tracts within the City of Utica. These are not the major ethnic groups that dominate the county population. Around 80% of people living in Oneida County identify themselves as being either Irish, Italian, German, Polish or English.

Instead these are the next most popular ethnicities/ancestries identified by people within each census tract. Generally speaking these are very small groups of people - typically somewhere between 50 and 2500 people. So these ethnicities or ancestries identified on the maps below are small pockets of of people who maintain an identification with less familiar backgrounds.

When looking at the maps beware of a couple of things. The exact locations of the people claiming to be "Canadian" in a tract, for example, is unknown. The placement of the label is purely a matter of convenience, not an indication of where any group specifically lives. Second, the size of the type is used to suggest the relative size of the populations in each group. Larger type size equals more people.

So take a look at your area, r4ecognize that most of the people that live there are probably one of the Big Five (Italian, Irish, German, Polish or English), but that there are other groups living in your community who may have a considerably different background than you have ! Click to enlarge the map.

CLICK TO ENLARGE

Monday, July 13, 2015

Small Ethnic Populations By Census Tracts In Herkimer

Below are two maps of Herkimer County. Each helps identify small ethnic populations within census tracts within the census tracts of the county. These are not the major ethnic groups that dominate the county population. Around 80% of people living in Herkimer County identify themselves as being either Irish, Italian, German, Polish or English.

Instead these are the next most popular ethnicities/ancestries identified by people within each census tract. Generally speaking these are very small groups of people - typically somewhere between 50 and 350 people. So these ethnicities or ancestries identified on the maps below are small pockets of of people who maintain an identification with less familiar backgrounds.

When looking at the maps beware of a couple of things. The exact locations of the people claiming to be "Canadian" in a tract, for example, is unknown. The placement of the label is purely a matter of convenience, not an indication of where any group specifically lives. Second, the size of the type is used to suggest the relative size of the populations in each group. Larger type size equals more people.

So take a look at your area, r4ecognize that most of the people that live there are probably one of the Big Five (Italian, Irish, German, Polish or English), but that there are other groups living in your community who may have a considerably different background than you have !

County-wide Tracts

CLICK TO ENLARGE


Valley and Village Tracts

CLICK TO ENLARGE

Thursday, July 9, 2015

Who Works From Home ? A Look at Our Regional Stay At Home Workers

Demo Memo recently released a piece on the education of people who work from home. In a similar vein I wanted to look at the backgrounds of people in our region that work from home. The graphic below provides some insight into the characteristics, as well as the types of jobs people do that work from their homes. It comes from the 2013 ACS PUMS data for the region.


Thursday, July 2, 2015

Five For the Fourth: The Top Five First Ancestries Cited in Each Municipality in Herkimer County

For this Fourth of July where we celebrate the melting pot that is our country, click on the table below to see the top five first ancestries cited by ACS respondents for each of the municipal areas of Herkimer County. Note within the town rankings where the town (with villages included) may have one set of top five ancestries, but when those villages are pulled out of the data, the remainder of the town might have a different leading ancestry !

Click on the table to enlarge it !

CLICK TO ENLARGE