Showing posts with label estimates. Show all posts

Thursday, August 20, 2015

Herkimer County 2014 Town, Village, and City Population Estimates

Click on the tables to enlarge them. These are the 2014 population estimates for each town, village and city in Herkimer County, as well as the remainder of towns minus village populations in the second table.

Herkimer County Town, Village, and City Estimates (2014)

CLICK TO ENLARGE

Herkimer County Town, Village, and City Estimates, With Remainder of Towns (2014)

CLICK TO ENLARGE

Wednesday, August 19, 2015

Oneida County 2014 Town, Village, and City Population Estimates

Click on the tables to enlarge them. These are the 2014 population estimates for each town, village and city in Oneida County, as well as the remainder of towns minus village populations in the second table.

Oneida County Town, Village, and City Estimates (2014)

CLICK TO ENLARGE


Oneida County Town, Village, and City Estimates, With Remainder of Towns (2014)

CLICK TO ENLARGE

Monday, July 20, 2015

Misusing The ACS: A Lesson in What NOT to Do


Recently an article appeared in the local paper citing a website created by the Economistsoutlook Blog which purports to compare recent gains in what they term "housing wealth", which is derived from rising home prices over the last several years. As the basis for their measurement they located, and compared, the FIVE YEAR ESTIMATES of the American Communities Survey from 2011 and 2013.


According to the local news article:
"Median home prices in the Utica zip codes of 13501 and 13502, increased from $91,500 to $94,800 and from $92,300 to $92,600 during the years examined, and saw housing wealth gains of $5,950 and $2,973 respectively.
The Herkimer zip code of 13350 saw the biggest housing wealth gain of $5,983 and also saw the largest jump in home prices – from $82,300 to $85,900."


The Economists Outlook use of the ACS data is TOTALLY WRONG BASED ON THE CENSUS RECOMMENDATIONS FOR USING THE ACS.

Here's just a few reasons why...

First, there is substantial overlap in the samples periods. The first period (the five year estimate for 2011) covers the following years: 2007, 2008, 2009, 2010, 2011 The second period (five year estimates for 2013) covers these years: 2009, 2010, 2011, 2012, 2013. Three out of five of these years are overlapping, a HUGE thing to avoid when comparing ACS estimates. 

Second, there is no mention of whether these differences are statistically significant or could be due to random variation. A simple comparison of the margins of error would tell you this, yet they fail to provide this information. So in fact, the small differences may be insignificant.

Third, the Census Bureau urges caution because of changes in the housing values provided by respondents from 2007 to 2008. Specifically they say that caution should be used when comparing ACS data on value from the years 2008 and after with pre-2008 ACS data. In 2007 and previous years, the ACS home value question included a series of categorical response options, and then a with a write-in for values over $250,000. Beginning in 2008, the response option became solely a write-in value for ALL homes. 

Fourth, it is important to realize that the value is the respondent's perception of what the house would sell for, and not an objective appraisal of fair market value. 

And finally there has been no adjustment for inflation between the vintage years of 2011 and 2013. In fact, many of the values cited may simply be functions of inflationary pressures, not a true increase in wealth.

In hindsight, it is important to recognize that the ACS can be tricky to deal with sometimes, and especially when it comes to comparing varying years. 

Friday, September 26, 2014

Another Single Year "What Herkimer County Might Look Like" Table on Housing

Yesterday I posted a piece about what Herkimer County's single year demographic data might look like IF SUCH A PIECE WERE DONE BY THE CENSUS BUREAU.

Single year estimates are restricted to areas of 65,000 population or more for statistic reasons. Herkimer County, having a population of less than 65,000 therefore doesn't get single year estimates. They have to wait until the three year estimates are released (October 23rd) to get new information.

Given that the MSA is the combination of Herkimer AND Oneida Counties, and given that we have Oneida Counties numbers on their own, it is PLAUSIBLE to simply subtract Oneida County from the MSA and then you'd be left with what is essentially a Herkimer County Single Year Estimate.

Without getting into a discussion of all the statistical reasons THIS IS PROBLEMATIC, let me again offer the following:

THE DATA BELOW IS NOT A PRODUCT OF THE US CENSUS BUREAU AND DOES NOT REPRESENT A STATISTICALLY SOUND PROCESS FOR DETERMINING THE CHARACTERISTICS OF THE POPULATION OF HERKIMER COUNTY. 

HOWEVER, IT IS A MATHEMATICALLY ACCURATE  REFLECTION OF THE UTICA ROME MSA MINUS THE ONEIDA COUNTY DATA FOR THE 2013 SINGLE YEAR ESTIMATES. 

THE RESULTS ARE ATTRIBUTABLE TO THE REMAINING AREA, NAMELY HERKIMER COUNTY.

So with that in mind here is are housing related data that MAY reflect what the three year official estimates will look like in about a month from now. Please view them with this in mind!


Thursday, May 22, 2014

2013 Sub-County Estimates Released By Census Bureau

The Census Bureau has released the sub-county estimates for 2013, which covers the cities, villages, towns and remainder of towns (minus the villages). Below are these data for Herkimer and Oneida Counties.

Herkimer County


Click to Enlarge


Oneida County 


Click to Enlarge


Friday, April 4, 2014

Population Counts, Estimates, and Projections: The Good, The Bad, and The Ugly

Most people are familiar with the traditional decennial census counts. Those are the numbers that come out, once every 10 years, as a result of the Constitutionally mandated census efforts. These have taken place since 1790, and will next occur in the year 2020. People, policymakers and businesses all look forward to the census counts as a way to see where we are, and how we've changed over the last decade. They also use these numbers for reapportionment of our legislative districts.

However, the decennial census counts aren't the only population numbers that get bandied about. In the non-decennial census years people often pay close attention to the population estimates, which get released annually. Each year, the Census Bureau's Population Estimates Program (PEP) utilizes current data on births, deaths, and migration to calculate population change since the most recent decennial census. Over the course of the years between decennial censuses, they produce a time series of estimates of population. The annual time series of estimates begins with the last decennial census year and extends to the vintage (i.e. most recent) year. These numbers are generally seen as indications of where we are and where we're headed.

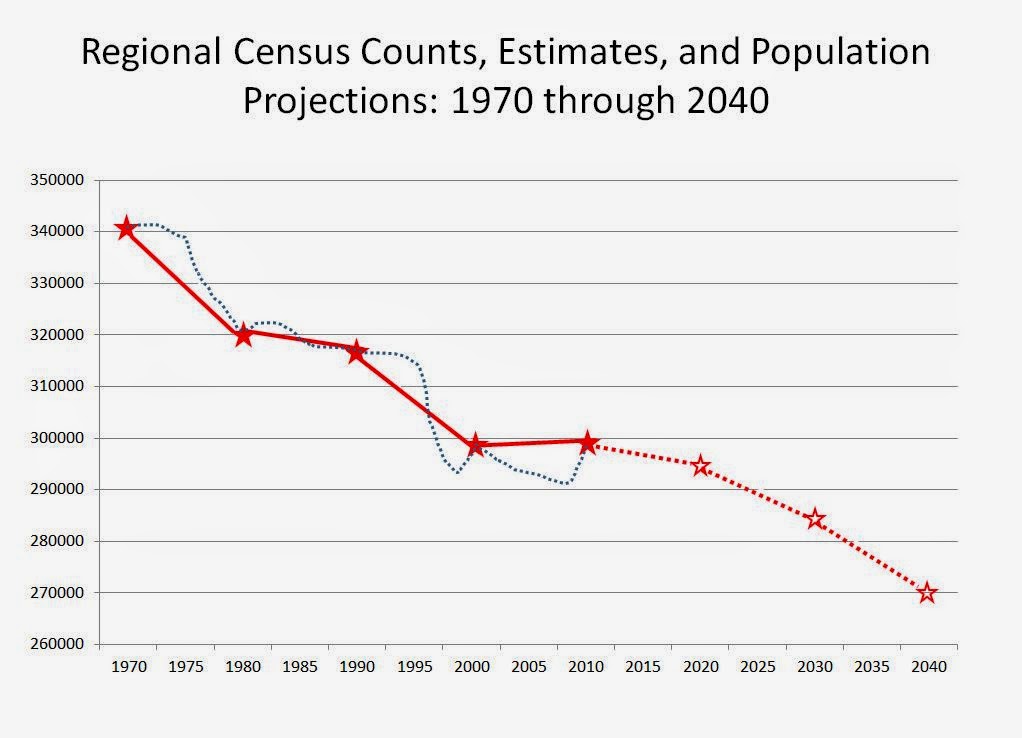
A third sort of population number that draws attention are population projections. While anyone can put together a population projection, many in New York turns to the projections done by Cornell University's Program of Applied Demographics (PAD). The projections done by PAD are in 5 year intervals and currently project to 2040. The projections are based upon rates of change estimated from historic data. This means that the projections reflect what would happen if the rates of population growth and decline stay as they were. The projections are not meant to be forecasts; forecasts are predictions of future conditions while these projections are meant to gain insight into what might happen if the future looks like the past.

For our region, these three versions of our past, and our future, are a sort of mixed bag - they are much like the Good, the Bad, and the Ugly.

The Good may be the decennial census counts. These can be considered "good" in that they are very accurate, generally speaking. The tremendous effort needed to identify housing units, and count the people in those units, provides very accurate numbers when it comes to our population counts. The chart below shows you the census counts for the Herkimer-Oneida Counties region from 1970 to the most recent census done in 2010.

Click to Enlarge

The Bad are the Population Estimates. They are bad, and that is a relative term, in that they appear to be consistently underestimating our population. Looking at the blue dotted line on the chart below, you can see that in about 1994, right through the Census in 2010, the estimates (based on the ninth vintage year in each cycle - 1999 and 2009 estimates) have consistently underestimated our population by around two percent. Some would maintain that two percent is negligible from a statistical standpoint; of course to the degree that these estimates impact federal or state formulas for funding, or business location decisions, that statistical distinction is anything but negligible.

Click to Enlarge

The Ugly comes down to the population projections, in this case those offered by PAD. While not arguing the methodology, the projections, as they note, are not forecasts - they assume that nothing in the future is different from anything in the past. And in the case of the past, they may or may not take into account special issues or circumstances for our region, such as the impact of the Mohawk Valley Resource Center for Refugees. Regardless, the projections see the last decade's population stabilization as fleeting and would suggest a continuing (and even accelerating) decline of population for the region in the future.

Click to Enlarge

In reality these are very different measures, with very different assumptions. But they are the numbers that are often used to define our region.

Friday, March 28, 2014

What A Difference A Year (or Two) Makes When it Comes to Population Estimates

Each year, the Census Bureau's Population Estimates Program (PEP) utilizes current data on births, deaths, and migration to calculate population change since the most recent decennial census and produce a time series of estimates of population. The annual time series of estimates begins with the most recent decennial census data and extends to the vintage (i.e. most recent) year.

Each "vintage" estimate includes revamped estimates for all the prior "vintage" years. With the release of the 2013 estimates, for example, the Census Bureau also releases estimates for each of the years from 2013 back to the most recent census, done in 2010. So there are new estimates for 2013, 2012, and 2011. When the 2014 estimates are released, the Census Bureau will release "readjusted estimates" (my words not theirs) for those previously produced estimates done in 2013, 2012, and 2011. Basically, each time the estimates are released, all the prior years get superseded by a new set of estimates.

This constant revision of the previous released estimates leads me to the statement, "What a difference a year makes!"

Below is a chart of the estimates (in dotted blue) and the Census counts (in red) since 1998 for what the Economic Development offices typically refer to as the "Mohawk Valley" - namely the counties of Oneida, Herkimer, Fulton, Montgomery, Schoharie and Otsego. These estimates are based on the ninth "vintage" year of the intercensal estimates program - in other words, the estimates for 2001, 2002, 2003, etc., through to 2009 are all from the estimates as they were released for vintage year 2009.

In 2010, a new set of estimates were released, adjusted in light of the Census 2010 numbers. These vintage 2010 estimates go all the way back and replace previously released estimates to the year 2001.

I wanted to compare the estimates, as they stood originally for 2009 with what the decennial census counts showed in 2000 and 2010.  Note that the 1999 number is from the vintage 1999 estimates, and how it compares to the Census 2000 counts.

Click to Enlarge
This comparison, I think, allows the viewer to see the relationship of the estimates to the reality of the census counts. In each case, the ninth year of the intercensal estimates is substantially lower than what the following years (2000 and 2010) Census counts find. The question becomes is this a systemic issue, and does it represent enough of a difference that we should be concerned?

In the end, if the estimates seem to be habitually lower than what the decennial Census counts show us, how much faith should we have in the estimates we saw recently released? More on this in a future post !

Thursday, March 27, 2014

2013 Population Estimates Released

The 2013 US Census Population Estimates were released today. The Census Bureau's Population Estimates Program (PEP) produces estimates of the population for the United States, its states, counties, cities, and towns. Demographic components of population change (births, deaths, and migration) are produced at the national, state, and county levels of geography. Additionally, housing unit estimates are produced for the nation, states, and counties.

These estimates are used in federal funding allocations, as survey controls, as denominators for vital rates and per capita time series, and as indicators of recent demographic changes. With each new release of annual estimates, the entire time series of estimates is revised for all years back to the last census. All previously published estimates are superseded and archived.

The table below shows the population estimates for counties in New York. It comes from the Cornell Program on Applied Demographics, which issues an entire report (viewable through that link) on the estimates.


Thursday, June 13, 2013

2012 Population Estimates for Cities and Towns

Each year, the Census Bureau's Population Estimates Program utilizes current data on births, deaths, and migration to calculate population change since the most recent decennial census and produce a time series of estimates of population, demographic components of change, and housing units. The annual time series of estimates begins with the most recent decennial census data and extends to the vintage year. These estimates are used in federal funding allocations, as survey controls, as denominators for vital rates and per capita time series, and as indicators of recent demographic changes. With each new release of annual estimates, the entire time series of estimates is revised for all years back to the last census. All previously published estimates are superseded and archived.

Below are the data showing the most recent population estimates for each county and their respective towns and cities. The two maps give you a quick visual as to areas (shaded in green) that the Estimates Program show as having gained population since the 2010 Census.


Click To Enlarge Herkimer County Map
Click To Enlarge Oneida County Map

Wednesday, May 22, 2013

2012 Population Estimates for NYS Counties

The Census Bureau's Population Estimates Program (PEP) produces estimates of the population for the United States, its states, counties, cities, and towns, as well as for the Commonwealth of Puerto Rico and its municipios. Demographic components of population change (births, deaths, and migration) are produced at the national, state, and county levels for each of these geographies.in addition , housing unit estimates are produced for the nation, for states, and for counties.

The population estimates are used in federal funding allocations, as survey controls, as denominators for vital rates and per capita time series, and as indicators of recent demographic changes. One of those surveys that is "controlled" by the estimates is the American Communities Survey (ACS). What that means is that the population estimates provided below for Herkimer and Oneida Counties in the 2012 estimate release will be the base figure (in essence the figure all characteristics are "controlled" to) when the 2012 ACS data is released later this year. With each new release of annual estimates, the entire time series of estimates is revised for all years back to the last census. All previously published estimates are superseded and archived.

Click to enlarge this table of the most recent population estimates for NYS Counties.

Click to Enlarge

Tuesday, April 10, 2012

2011 Population Estimates for NYS Counties

As noted earlier, the US Census Bureau has released the July 1, 2011 county level estimates for our region. Below are the estimates for every county in New York based on the estimates program.

Release of 2011 Estimates of Population from the Census Bureau

Every ten years, the U.S. Census Bureau conducts its decennial census. In the non-decennial years, the Bureau produces and publishes estimates of the population for each state and county, as well as the nation as a whole. This series of estimates is part of the (no surprise here in its name) Estimates Program.

The most recently released estimate (the July 1, 2011 estimate) is the first based solely on the 2010 Census counts and what are referred to as the components of change. As estimates are produced each year between the decennial censuses, the entire estimate series is revised and updated. For each state and county, the Census Bureau each July releases annual estimates of the resident population by age, sex, race, and Hispanic origin. These estimates are produced largely through an analysis of three components of population change: births, deaths, and migration.

To estimate births, the Census Bureau utilizes birth certificate data collected by the National Center for Health Statistics (NCHS). NCHS provides final individual birth records for births occurring before January 1, 2010.

To estimate deaths, the Bureau utilizes death data collected by NCHS. NCHS provides final individual death records for all deaths occurring before January 1, 2010 by residence, age, sex, race, and Hispanic origin of each decedent, as well as the place and date each death occurred.

International migration estimate has several parts: immigration of the foreign born, emigration of the foreign born, net migration between the United States and Puerto Rico, net migration of natives to and from the United States, and net movement of the Armed Forces population to and from the United States.

The Census Bureau also estimates net domestic migration separately for two population universes – those living in household and group quarters and for those in each of two age groups (0 to 64 years and 65 years and older).

For the 0 to 64 year old household population, the Census Bureau uses Federal income tax returns supplied by the Internal Revenue Service (IRS) to track person-level data on filers and dependents aged 0 to 64 years. Two years of IRS tax returns are matched and the addresses are compared to identify the number of individuals (represented by exemptions) who moved from one county to another between tax filings. A process is used to account for non-tax filers.

For the 65 years and older household population, the Bureau uses annual Medicare enrollment data for each county from the Centers for Medicare and Medicaid. As with the IRS data, not all U.S. residents aged 65 and older receive, or are eligible to receive, Medicare benefits. Therefore, a separate process accounts for those not part of the Medicare process.

To estimate the net domestic migration of the group quarters population, data from the Census 2010 is used, in combination with data collected from a special survey of these facilities called the Group Quarters Report.

To see all of the estimates for the country you might want to visit the Census Bureau Population Estimates web page.

To see some great analysis of NYS counties you may want to read this piece by Cornell Program of Applied Demographics.

Friday, April 1, 2011

The Three Pillars of Census Based Data

When most people hear the words "Census Bureau" they only think of one thing - "the" census. Of course what they really mean is the "decennial" census, being that survey we all take once every 10 years as part of our constitutional duties. In reality the Census Bureau conducts a slew of surveys covering a wide range of topics. However, there are three that are interrelated that I want to review here. Because they are often confused with one another, it is important to understand how they differ and what that difference means for the data user.

The first is the data product mentioned above - the decennial census. The decennial census is conducted once every 10 years, administered officially on April 1 of any year ending in a zero. Historically the decennial census has been used to capture not just population counts but also to help flesh out the character of the people living in the country. It did this by offering two forms - a short form and a long form.