Showing posts with label elderly. Show all posts

Friday, November 6, 2015

Our Aging Workforce: Increases in Older Worker Participation by 2020


A couple charts showing where we are, and where we may be headed regionally with an aging workforce.

Looking at the workforce age 65 and over, there has been an increasing trend in the size of our elderly workforce over the last 10 years. As a general statement, we have gained roughly 200 more workers in this age group each year.

The chart below shows this trend and breaks the age groupings down further: from 65 to 69; 70 to 74; and 75 and over. In each case, the region has seen increases in workers in these subgroups over the last ten years.

CLICK TO ENLARGE

Based on this trend, a simple projection would suggest that as many as 1,000 MORE workers age 65 or older will be joining these ranks by the year 2020. Here's a look at how that thousand additional older workers will be distributed by age groupings by the end of this decade.


CLICK TO ENLARGE

Tuesday, November 3, 2015

Regional Elderly Population In or Near Poverty (2006-2014)

The graph below shows changes in the percentage of older regional residents (age 65 or older) who were either in poverty, or near poverty (within 150% of the poverty level). Click the graphic to enlarge it.

CLICK TO ENLARGE

Thursday, October 29, 2015

Supplemental Nutrition Assistance in Regional Households with Elderly Present

Over the last decade, more and more households where at least one member was age 60 or older have received what used to be called "food stamps". It now goes by the name the Supplemental Nutrition Assistance Program, or SNAP.

Since 2005, our region has seen participation in this assistance program basically triple among households where the elderly reside. In 2005, about 5.4% of households where someone age 60 or older resided used food stamps; in 2014 nearly 15% of those households do. This represents an actual increase of some 4,600 households where an elderly person resides that now are participating in SNAP that hadn't been a decade ago.

Click on the chart below to enlarge it and see how this has changed over the last 10 years.

CLICK TO ENLARGE

Monday, March 23, 2015

Households With a Vehicle And Someone Age 65 or Older Present In Herkimer County

One in four households with a vehicle in Herkimer County have at least one elderly resident present according to the American Communities Survey.

CLICK TO ENLARGE

Wednesday, March 4, 2015

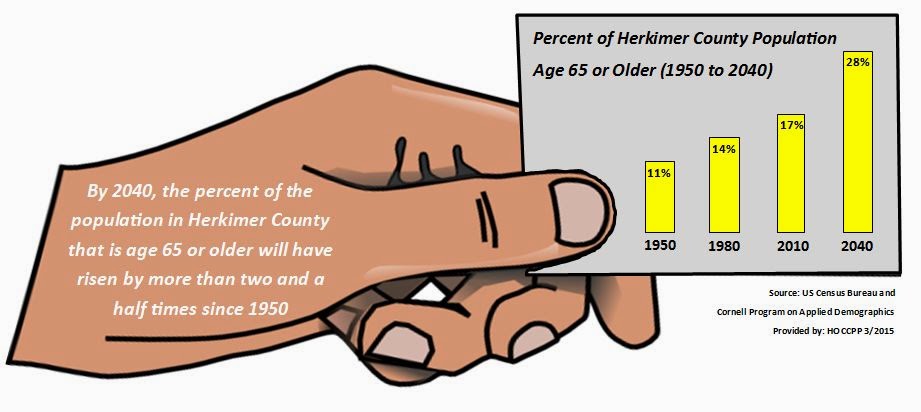
Boomergedden: Senior Citizens as a Percent of Population in Herkimer County

This graphic shows the projected rise of senior citizens (people age 65 and older) in Herkimer County. The projections are from the Cornell University Program on Applied Demographics. The historical data comes from the US Census decennial counts. Some have referred to this movement of Baby Boomers into the ranks of senior citizenry as "Boomergedden".

Click on the graphic to enlarge it.

CLICK TO ENLARGE

Wednesday, January 7, 2015

Herkimer County and Older Populations with Disabilities

The Census Bureau has released a report entitled Older Americans With A Disability: 2008-2012  which breaks out a variety of disabilities present among our older population members. Data for this report came from the 2012 ACS 5-year estimates. The 5-year estimates are ideal for conducting meaningful and statistically reliable analyses of special population groups, such as the older population with a disability, not only for the entire nation, but also for states and counties. The report examines the demo-graphic and socioeconomic characteristics, as well as the geographic distribution of the older population with a disability, with a focus on those in poverty or living alone.

One of the first things to recognize is what the ACS uses as a definition of "disabled". Below is a piece from their report laying out the six basic categories of disabilities that they measure.


Based on those definitions here is a map of the percent of those age 65 or older that are disabled for every county in the US. Click to enlarge the map.


Click to Enlarge

The following data provides insight into the age and type of disabilities for Herkimer County residents as well as the prevalence of multiple disabilities.


Click to Enlarge


Tuesday, December 23, 2014

Herkimer County Households Without a Vehicle Available and Elderly Heads of Households

The map below comes from the 2013 ACS Five Year Estimates for Herkimer County and shows the block groups in which at least 10% or more of the households have no vehicle available. In addition, the hatched areas identify those same areas where 40% of more of these households lacking a vehicle are headed by someone age 65 or older.

So not only are the hatched areas block groups where a substantial part of the population lacks a vehicle, those that DO lack transportation are often elderly.


Just an example of what is out there in the five year estimates if you look hard enough ! For a closer look click the map below !

Click to Enlarge

Tuesday, October 14, 2014

A Look at Seniors in Herkimer County From the 2012 ACS Five Year Estimates

Below are two tables showing characteristics of the current population age 65 and over in Herkimer County. New data for Herkimer County will be available at the end of this month in the form of the 2013 ACS Three Year Estimates!

Herkimer County Elderly Profile (Part 1)

Click to Enlarge Part 1


Herkimer County Elderly Profile (Part 2)

Click to Enlarge Part 2

Friday, September 5, 2014

A Look at the Golden Years: Characteristics of Retirees in the Region

While a recent article about the best and worst cities to retire to wasn't particularly kind to the northeast, some still choose to stay in our region once they make the decision to retire. While a myriad of factors are to be considered, our region still has much to offer its older citizens.

Who, however, are those among us that have entered into their Golden Years and chosen to remain locally?

Well, the 2012 ACS Five Year Estimates for PUMS data does allow us to get at least a little insight into who are retirees are. First however, I needed to figure out how to extract at least a reasonable estimation of what a retiree is from the data. For purposes here, the following is basically who I looked at in order to gain insight into the characteristics of retirees.


So as the graphic points out, I took the population of people age 62 or older (typical minimum age for social security access) and then selected anyone who reported receiving a pension or retirement annuity, or that received social security retirement benefits as either a primary recipient or as a survivor.

While the definition is NOT perfect, it does capture a large number of people that certainly are in retirement mode. In fact, 85% of all people age 62 or older are included in this definition - some 37,000 out of about 43,000 people in this age category.

Roughly 60% of all "retirees" are still married, but about a quarter have no surviving spouse - they are widows and widowers.

Click to Enlarge

As a result, it's not surprising then that 56% of retirees are females.


Racially and ethnically, the retirees are not wholly reflective of the current racial configuration within the region - they are more in line with the racial distribution of their own day, 40 to 50 years ago. Whites make up the vast majority of those retiring in the region - around 86% of all retirees are white. Black retirees are the next largest group, at 11%. Very few other minority races are represented in the retirement crowd. This is mainly the result of their lack of presence in the past within our region. Similarly, only 2% of all retirees see themselves as Hispanic. While at present the Hispanic community makes up more than 4% of the region's population, their influx is a relatively new phenomena, hence fewer Hispanics are nested within the retirement cohort.


Educationally, retirees are a reasonably well educated group. More than a quarter of them have some type of college degree, and one in five have a bachelor's or higher.


As the "Greatest Generation" passes, the current "Baby Boomers" are not without their military experience. More than a quarter of all retirees have served in some capacity in the armed services.

Of course as we age we face many hurdles, some of which are truly disabling. These can include visual issues, mobility issues, hearing and cognitive issues, as well as a host of other conditions. More than one out of every three retirees reported being disabled to some extent.

Similar to the racial and Hispanic retirees, foreign born residents make up a slightly smaller part of the pie among retirees than they do in the current general population. Given the influx of recent refugees to our region this is not particularly surprising.


Slightly more than 5% of retirees are foreign born, and about 6% speak a language other than English while at home. Most are in fairly stable housing settings, with only one out of twenty (5%) having lived somewhere else one year ago.

Retirement, of course, is largely based on your ability to afford it.

According to the ACS data, each retiree averages an income of about $37,000 in the region. This is composed of a variety of income sources of course, two of which are typically a pension or annuity, and social security retirement benefits. Roughly 17,000 retirees (or about 40% of people age 62 and over) drawn from a pension or a retirement annuity or IRA. And nearly 35,000 retirees (or 81% of those age 62+) are receiving Social Security Retirement benefits. Combined, taking into account those that receive both a pension and social security, 36,951 retirees access these income resources.

Click to Enlarge
Of course there are other potential resources such as personal savings, reverse mortgages, etc., that retirees might also be using to fund their retirement plans.

Friday, August 8, 2014

A Quick Regional Look at Disabilities

One of the more difficult pieces of data to get access to over the years has been data on disabilities. To begin with, disability information is typically self-reported, as opposed to agency or service identified. Second, there just hasn't been a good source for this information down to the local level - until recently with the advent of the American Communities Survey.

Below are three graphs. The first is a simply pie chart showing how around one out of every eight citizens (13%)  regionally claim to have a disability.

Click to Enlarge
Next, the bar chart below shows the number of disabilities claimed within six classifications. Some of the almost 32,000 people regionally that indicated that they have a disability may, in fact, have claimed several different disabilities, so the total number of disabilities shown below is naturally higher than the total number of people claiming to be disabled.

Click to Enlarge
And the last bar chart is similar to the one above, but in  his case it focuses on the elderly, those age 65 or older. I offer it as an example of how the data might be looked at further. Hopefully such a look will come with input from those that find the data particularly useful!

Click to Enlarge

Wednesday, July 16, 2014

Characteristics of Those Age 65 and Over in the US and Regionally

Yesterday it was a post about young moms and female fertility - today it is about our elder population. The Census Bureau recently released what might be the definitive report of those age 65 and over in the US recently. It covers far, FAR more than could ever be generated locally. Take a look and perhaps there are a few areas of interest that we could try to replicate on a regional basis.

In the meantime, here is Table S0103 from the 2012 Five Year ACS estimates for the combined Herkimer-Oneida Counties area. It covers a LOT of data pieces showing the total population facts and figures compared to those for our older citizens.

Click to Enlarge

Tuesday, May 6, 2014

Happy Older Americans Month !!!


A meeting with the National Council of Senior Citizens resulted in President John F. Kennedy designating May 1963 as Senior Citizens Month, encouraging the nation to pay tribute to older people across the country. In 1980, President Jimmy Carter’s proclamation changed the name to Older Americans Month, a time to celebrate those 65 and older through ceremonies, events and public recognition. 
 
Below are some factoids from the US Census Bureau, with local data included in parens. To read more statistics about Older American's Month, visit the Census Bureau's Newsroom.

The Numbers   

43.1 million - The number of people who were 65 and older in the United States on July 1, 2012. (38,268 in OC; 11,027 in HC) This group accounted for 13.7 percent of the total population. (16.3% in OC; 17.1% in HC)

92.0 million - Projected population of people 65 and older in 2060. (In 2040, projected to be 47,574 in OC; 14,614 in HC) People in this age group would comprise just over one in five U.S. residents at that time. (21.8% in OC; 27.9% in HC in 2040) Of this number, 18.2 million would be 85 or older. (In 2040, projected to be 8,421 in OC; 3,393 in HC)


Income and Poverty

$33,848 - The 2012 median income of households with householders 65 and older, not significantly different from the previous year. ($33,592 in OC; $28,170 in HC)

9%  - The percent of people 65 and older (3.9 million) who were in poverty in 2012. (9.5% in OC; 10.8% in HC)


Serving Our Nation

9.6 million - Estimated number of people 65 and older who were veterans of the armed forces in 2012. (8,946 in OC; 2,589 in HC) 


Jobs: Older Workforce Members 1990-2012

Click to Enlarge


Education

82.6% - Proportion of people 65 and older in 2013 who had completed high school or higher education. (78% in both OC and HC) 
 
25.3% - Percentage of the population 65 and older in 2013 who had earned a bachelor’s degree or higher. (16% in OC; 17% in HC)


Marital Status and Living Arrangements

58% - Percentage of people 65 and older who were married in 2013. (49% in both OC and HC)

26% - Percentage of people 65 and older in 2013 who were widowed. (32% in OC; 31% in HC)


Centenarians

53,364 - The number of people age 100 and older counted by the 2010 Census. (58 in OC; 7 in HC)

Wednesday, April 30, 2014

CGR Report on the Future of County Nursing Homes in NYS


Virtually all nursing homes across New York State, whether operated by a county, for-profit company, or non-profit operator face wide ranging, significant challenges. For county-owned homes, however, the future is especially troubled.
 
Click to Enlarge
 
The Center for Governmental Research (CGR) of Rochester conducted a year-long, statewide study that focused on nursing homes owned by 33 counties, four homes sold by other counties since 2005, and two homes closed by counties in recent years.

CGR’s recommended guidelines for county officials and nursing home administrators include developing county long-term care plans and expanding community-based services; and strengthening working relationships between nursing home administrators, labor representatives and county officials to make county homes more financially viable.

For those counties that opt to sell their homes, the guidelines call for establishing clear county criteria and expectations for potential buyers to meet; and holding potential buyers accountable for meeting those expectations.

To view the entire report and their recommendations visit this link from CGR.