
Showing posts with label business. Show all posts
Showing posts with label business. Show all posts
Friday, February 26, 2016
Regional Businesses Located in Households
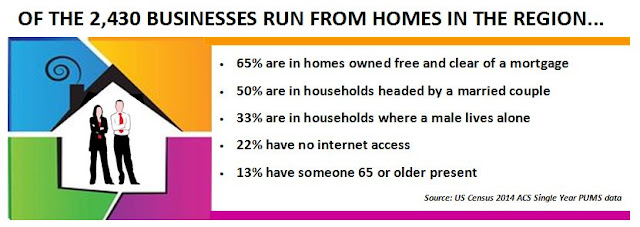
Based on Census data from the 2014 ACS, here's a look at businesses that are operated out of residential homes in the two county region. Click on the graphic to enlarge it.

Tuesday, July 9, 2013
Purchasing Power, Business Activity, and Workforce Density By Zip Codes

The University of Wisconsin-Milwaukee
Employment and Training Institute provides comparison data on purchasing power, business activity and workforce density for all residential
ZIP codes and the 100 largest metro areas in the U.S. The profiles are designed to
help cities, businesses, developers, and organizations assess the advantages of
urban density for underserved city neighborhoods.it is a pretty simple process to type in your zip code and then get a nice summary of all three of these aspects of any given zip code. The main problem with this data at the moment is it has NOT been updated to the most recent census data - it was created largely using the Census 2000 information.
While this is a drawback, the site nonetheless is unique and provides quite a bit of insight to an area's economic strengths. For example, here is a print out of just one of the tables that they provide, in this case for the Herkimer zip code (13350).

As you can see it provides annual expenditures on purchases as well as expenditures per square mile within the zip code area for a list of 16 different types of purchases. These 16 are defined as follows:
- FOOD AT HOME
- includes expenditures for food purchased at grocery stores and convenience stores, and food prepared at home for out-of-town trips.
- FOOD AWAY FROM HOME
- includes expenditures for meals at restaurants, carry-out orders, food purchased on out-of-town trips, school lunches, and meals as pay.
- APPAREL AND RELATED SERVICES
- includes expenditures clothing (suits, coats, sweaters, shirts, skirts, nightware, undergarments, hosiery, uniforms, costumes, etc.), accessories, footwear, material for making clothes, watches, jewelry, shoe repair, laundry and dry cleaning costs, and clothing storage.
- TELEVISION EQUIPMENT, TAPES AND DISCS
- includes expenditures for TVs, VCRs and video disc players; video cassettes, tapes and discs; video game hardware and software; cable and satellite service; repairs of TVs, radio and sound equipment; and rental of televisions.
- AUDIO EQUIPMENT, CDs, AND TAPES
- includes expenditures for radios; tape recorders and players; sound components and component systems; records, CDs, audio tapes, and needles; record, tape, CD and video mail order clubs; musical instruments; accessories and other sound equipment; satellite dishes; and rental of above equipment.
- HOUSEHOLD TEXTILES
- includes expenditures for bathroom, bedroom, kitchen and dining room linens; curtains and draperies; slipcovers and decorative pillows; sewing materials for the home.
- FURNITURE
- includes expenditures for mattresses and springs; sofas; living room tables and chairs; kitchen and dining room furniture; infants' furniture; outdoor furniture; wall units, cabinets and other occasional furniture.
- FLOOR COVERINGS
- includes expenditures for wall-to-wall carpeting (for renters and homeowners) and non-permanent floor coverings.
- MAJOR APPLIANCES
- includes expenditures for dishwashers, garbage disposals, refrigerators, freezers, washing machines, clothes dryers, cooking stoves, microwave ovens, air conditioners; floor cleaning equipment, and sewing machines.
- SMALL APPLIANCES AND HOUSEWARES
- includes expenditures for china, dinnerware, flatware, glassware, serving pieces, small electric kitchen appliances, and portable heating and cooling equipment.
- COMPUTER HARDWARE AND SOFTWARE
- includes expenditures for computers, computer hardware, computer software and accessories, for nonbusiness use.
- MISCELLANEOUS HOUSEHOLD EQUIPMENT
- includes expenditures for window coverings, infants' equipment, outdoor equipment, clocks, lamps and lighting fixtures; other household decorative items; telephones and accessories; lawn and garden equipment; power tools; hand tools; plants and fresh flowers; closet and storage items; rental of furniture; and luggage.
- NON-PRESCRIPTION DRUGS AND SUPPLIES
- includes expenditures for non- prescription drugs, non-prescription vitamins, eyeglasses and contact lenses, topicals and dressings, medical equipment for general use, supportive and convalescent medical equipment, and rental and repair of medical equipment.
- HOUSEKEEPING SUPPLIES
- includes expenditures for laundry and cleaning supplies, cleansing and toilet tissue, paper towels and napkins, miscellaneous household products, and lawn and garden supplies.
- PERSONAL PRODUCTS
- includes expenditures for hair care products, nonelectric articles for the hair, wigs and hairpieces, oral hygiene products and articles, shaving needs, cosmetics, perfume, bath preparation products, deodorants, feminine hygiene articles, and miscellaneous personal care items.
- HOME REPAIR COMMODITIES
- includes expenditures for paints; wallpapers; electrical supplies for heating and cooling equipment; materials for hard surface flooring, repair and replacement; materials and equipment for roof and gutters; materials for plastering, paneling, siding, windows, doors, screens, awnings; materials for patios, walks, fences, driveways, brick, masonry and stucco work; materials for landscaping maintenance; materials to finish basements, remodel rooms, or build patios, walks, etc.
A visit to their methodology page is worth it if you want to fully understand not only how they defined these purchases but also how they then measured purchasing power, etc. In the meantime, feel free to visit the site and punch in your local zip code and see how it compares to others in your surrounding area - just remember that these are OLD data sets. If new ones become available I will be sure to post about it !
Monday, May 20, 2013
Small Business Week in Herkimer County: May 19th to May 25th
 The Herkimer County Chamber of Commerce has declared this week Small Business Week in Herkimer County.According to an article in the Little Falls Times this is the second time the county has embraced this event. Most of what follows is from that article.
During a press conference at the Herkimer County Chamber of Commerce Office earlier this month, Legislature Chairman Vincent Bono read a proclamation that announced the county would participate in the May 19 to 25 observance of National Small Business Week. “Since 1968, the Herkimer County Chamber of Commerce has been assisting businesses to grow and has created a positive environment for businesses as they create jobs, support taxes and plan local events. We want to thank them for all they do,” said Bono. “Small businesses are the cornerstone of our community and we should support them every chance we get. What makes them such a commodity is they help add a better quality of life for Herkimer County.”
This year marks the second year for Small Business Week in Herkimer County. “Last year, Small Business Week wasn’t heavily promoted with as many events, but this year the county is making its first attempt at doing it properly,” said Herkimer County Chamber of Commerce Executive Director John Scarano. “Small business in our community is paramount. Ninety-nine percent of the businesses in Herkimer County are considered small businesses and small businesses make up this county. They give to us and we need to give back to them. At least one week out of the year we need to show our support,” he added. “It’s an obvious point in economic development that small business drives the train,” said Herkimer County Administrator James Wallace.
As a way for the county to show its support the Chamber is teaming up with title sponsor Herkimer County Community College and community sponsors Adirondack Bank, NBT Bank, the Herkimer Area Resource Center, Remington Arms and First Source Federal Credit Union to promote a week of events.
A full schedule of events appears on the Chambers facebook page, and a listing of various discounts available at small businesses in Herkimer County is also available.
 |
| Click to Enlarge |
Tuesday, May 8, 2012
Business Dynamics Statistics in Herkimer and Oneida Counties: Establishment Births and Deaths

The Herkimer and Oneida
Counties region (or what
is known as the Utica-Rome Metropolitan Statistical Area, or U-R MSA) has faced
incredibly difficult hurdles over the last 20 years. With the closing of
several major businesses, as well as the realignment of Griffiss Air Force Base
(GAFB), the economic impacts on the region have been unprecedented. Below are
several pieces of data from the BDS data base, as well as the Small Business
Administration’s (SBA) Office of Advocacy . The SBA Office of Advocacy offers
data through its Statistics of U.S. Businesses (SUSB) program to track establishment
births and deaths, as well as the associated job creation and loss with each of
those respectively.
For example, looking at the chart below, you can see
how establishment loss spiked in the early and mid-1990s in our region. At the same time, new
businesses moving into the area also dropped precipitously just prior to the
decision to close GAFB, and then for the remainder of the decade following its
closure.

Since the start of the new millennium, business births and
deaths appear to both be increasing slightly, but in fits and starts.
So how do establishment births and deaths impact job growth
in the region ? Well below is a chart showing establishment births and
deaths just for the last 5 years worth of SUSB data (2003-2007). As you can see, in
all but one of the years the number of business deaths outnumbered the business
births regionally.

However, in three of the last 5 years there have been more
jobs created by newly created establishments than lost by those that have closed. This is especially true in 2007. So it’s not just about the number
of establishments created or lost, but the size of those establishments.
In the
U-R MSA, about 22.5% of all newly formed establishments are among companies of
20 or more employees; establishments of this size (20 or more employees) only
make up about 19.7% of all business “deaths”. So the region is seeing slightly more
midsize to large companies creating jobs in new establishments than they are
losing.

Subscribe to:
Posts (Atom)