Tuesday, April 21, 2015

Worker Status: Full-Time and Part-Time Workers in Families

Two parent working families are something we often read about, but rarely see data on. The PUMS data for our region provides some insight into full-time as well as part-time workers in families.

The graph below shows the prominence of full-time workers, part-time workers, and no workers for families with two parents present, as well as single parent families.  Almost three out of four two parent families (72.4%) have at least one full time worker present. However, only 40% of two parent or married couple families are lucky enough to have BOTH parents working full time jobs. In addition, as many as a quarter of two parent families (26%) only have a single full time worker, where the spouse has no employment.

When looking at working fathers, as many as 62% have a full time job, compared to only 45.5% of working mothers. While slightly more than a quarter of single fathers and mothers work only part-time positions (27.3% and 28.4% respectively), single mothers are fair more likely to be unemployed (26.0%) compared to single fathers (10.7%).

Please note: Any household with someone age 65 or older present was excluded in order to not inflate the number/percentage of families where the householder is a retiree and not working. Hopefully the targeted families examined here are thereby headed largely by working age householders between the ages of 16 and 64.

CLICK TO ENLARGE

Tuesday, April 14, 2015

Home Ownership Turnover: Percent of Owner Occupied Homes With New Owners Since the Year 2000

The map below is based on the 2013 ACS Block Group data for the region. It represents the percent of owner occupied homes that have new owners since the year 2000 for each block group in the region.

Block groups are simply smaller parts of census tracts. These block groups are broken into those where half or more of the homes have changed hands, 40 to 49 percent have new owners, 30 to 39 percent are now owned by someone other than who owned them in the year 2000, and those where less than 30% have changed owners. Basically this is from the most active area of turnover to the least active area of turnover.

Also note: the green areas are block groups with fewer than 50 owner occupied homes present. For statistical purposes, they were excluded from the review of change in ownership due to the small number of homes in those areas.

Click to enlarge the map !

Click to Enlarge

Wednesday, April 8, 2015

Stay Connected II: How We Compare to the Rest of Upstate New York

Yesterday I posted some internet related data for our two county region from the single year 2013 ACS estimates. Today, I turn to the Public Use Microdata (PUMs) to take a bit deeper look at our region as it compares to the rest of upstate New York.

For purposes here, two PUMAs (Public Use Microdata Areas - the geography underlying the PUMS data) cover 80% of the combined Herkimer- Oneida region. All but the southern most towns in both counties are included in this loosely defined geographical "region". That regional data was then compared to the rest of "Upstate New York" - namely all of the rest of New York except for the city of New York and Long Island. Because these are accessed on the basis of PUMAs, don't be disturbed if these numbers are slightly different from yesterday's - with different geographies come different statistics!

Below are several graphics showing how we compare regionally to the rest of Upstate New York. These are based on the single year ACS PUMs estimates for 2013.

To begin with, almost all of the upstate area, including our region, has some sort of telephone coverage, be it a landline at home, or cell service.


Many of us use mobile broadband services, especially for our "smart" phones. The percentage, however, may not be as large as you might think, and is less than the percentage of households in other parts of upstate New York.


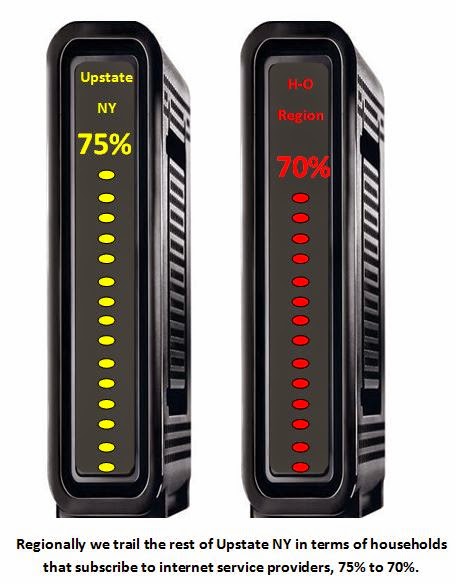
In terms of subscribing to an internet service provider, our region slightly trails the rest of the upstate area.


When it comes to the type of subscription services we used for internet access, cable modem access dominates across the state, but especially in our region.

CLICK TO ENLARGE


Some households, however, remain without internet access. Slightly more households in our region lack access than in the rest of the upstate NY area.


And when it comes to staying connected, we have all the typical computer related devices available: laptops, desktops, tablets and cell phones. Generally speaking, fewer households in our region own these devices than do the households in the rest of upstate New York.

CLICK TO ENLARGE

Tuesday, April 7, 2015

Staying Connected: Computers and Regional Access To the Internet

One of the new areas included in recent American Community Surveys are questions on accessing the internet, as well as the availability of home computers and mobile devices. Below are several graphics from the Utica-Rome Region (Herkimer and Oneida Counties combined) which begin to explore some of this new found data !


Overall Internet Usage


Subscription Service Access

CLICK TO ENLARGE


Internet Access by Income

CLICK TO ENLARGE


Computers Presence and Internet Access

CLICK TO ENLARGE