Showing posts with label unemployment. Show all posts

Thursday, January 14, 2016

A Look at Those That Work and Those That Are Not Working in Herkimer and Oneida Counties


People who are neither working nor looking for work are counted as “not in the labor force,” according to the U.S. Bureau of Labor Statistics. A recently released article from the BLS takes a look at those not in the labor force in depth. Since 2000, they conclude that the percentage of people who are not working has increased. Data from the Current Population Survey (CPS) and its Annual Social and Economic Supplement (ASEC) provide some insight into why people are not in the labor force.

Data from the CPS and ASEC found that from 2004 to 2014, there was an increase in the proportion of the population 16 years and older that was not in the labor force.  Increases were cited specifically among those attending school, those having an illness or disability, or those that entered retirement as their main reasons for not working. The percentage of people who were not in the labor force and the reasons they gave for not working varied by age and gender. Here are a few examples of some of their findings based on respondent characteristics:

  • Youth: Among younger people, the percentage not in the labor force rose sharply and the most often cited reason for not working was school attendance.
  • Working Age: The percentage not in the labor force also rose for both men and women 25 to 54 years of age, and nearly all of the reasons cited previously recorded an increase.
  • Gender: Women between 25 and 54 were more likely than men to cite home responsibilities as the main reason for not working.
  • Educational Attainment: Men and women 25 to 54 years with less education were more likely to be labor force nonparticipants than their counterparts with more education. From 2004 to 2014, the increases in the percentage of men and women not in the labor force were larger for those with less education. People with less education were more likely than those with more education to cite illness or disability as the main reason for not working.
  • Older Adults: The proportion of older adults who were not in the labor force declined from 2004 to 2014. Older adults were most likely to cite retirement as the main reason for not working, although the percentage who cited this reason fell. The older adult population saw an increase in the proportion who cited illness or disability as the main reason for not working. 

Regionally, the chart below provides some insight on who is and who isn't part of the labor force for the population 16 and over for both Herkimer and Oneida Counties. About 60% of the population in each county works, either full-time, part-time or by being enlisted in the armed forces. These are the blue parts of the "doughnut". Thirty seven percent (37%) of all people over age 16 work full-time year-round; another 21% work less than full-time year-round.

CLICK TO ENLARGE

Roughly 40% of the population age 16 and over do not work (the red portions of the chart above). The largest portion of people not in the labor force are retirees (16%). The remaining non-working portion of the population is spread pretty evenly between the ill or disabled (7%), those attending school (6%), those with home responsibilities (6%), and those that are unemployed (5%).

To even get a better understanding of these subgroups, I have provided some breakouts for each one below. The basic graph (the doughnut) is the same, but I have added a few "factoids" as they apply to that group in either Herkimer or Oneida County, respectively. Click the one you'd like to know more about to make it larger for viewing purposes.

Herkimer County


CLICK TO ENLARGE


Oneida County

CLICK TO ENLARGE


Friday, May 1, 2015

March 2015 Labor Market Profile and Unemployment Rates

From the New York State Department of Labor...click either one to enlarge them.

CLICK TO ENLARGE
CLICK TO ENLARGE

Thursday, July 31, 2014

Tuesday, May 27, 2014

Unemployment and Our Regional Employment Profile: April 2014


Mark Barbano, the Mohawk Valley's Regional Economist at the New York State Department of Labor, recently provided the two tables below covering our regional/county unemployment rates, as well as our regional Labor Market Profile.

Click to Enlarge
 
Click to Enlarge

Wednesday, April 2, 2014

Labor Market Profile and Unemployment Data for the Mohawk Valley (Feb 2014)

The following data on unemployment and the labor market profile was released yesterday by the Department of Labor.


Click to Enlarge

Thursday, March 13, 2014

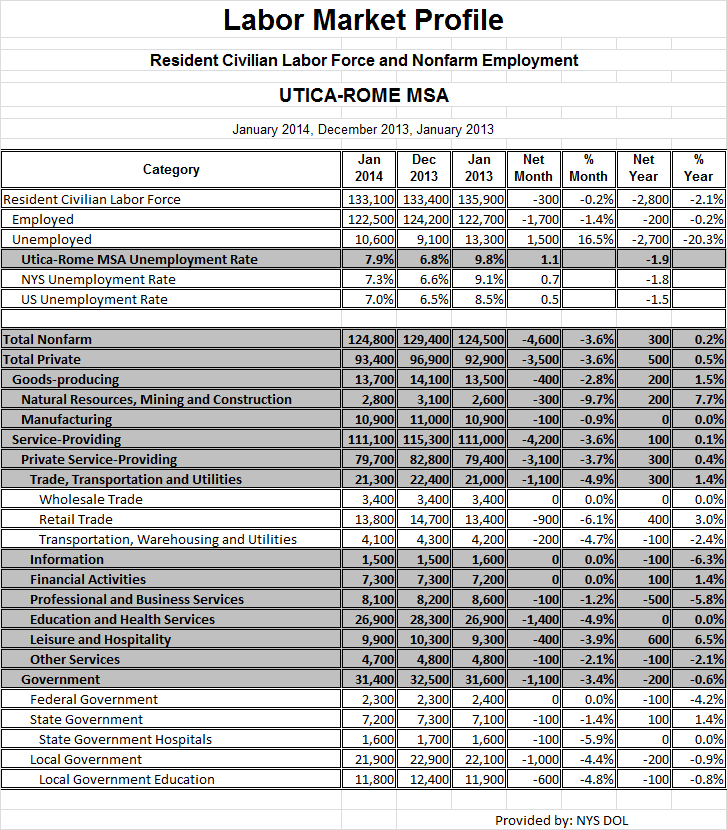
Labor Market Profile and Unemployment Data for the Mohawk Valley (Jan 2014)

Since it's been six months since I last posted the regional unemployment and labor market profile data, I thought this would be a good time to share these. They came to me through Mark Barbano, our Regional Economist in the New York State Department of Labor. 

You can click each to enlarge them for better reading.

Click to Enlarge

Click to Enlarge

Thursday, July 25, 2013

Thursday, May 30, 2013

Welcome to the Real World: New Graduates and Unemployment Rates

A study just released by the Georgetown University Center on Education and the Workforce lays out the employment prospect for recent college graduates. The Georgetown report used the American Community Survey (ACS) data from 2010 and 2011 for its analysis. For recent graduates, it looked at 22- to 26-year-olds who had bachelor’s degrees, and for more experienced college graduates it looked at 30- to 54-year-olds with college degrees. The report offers a reminder that while lots of young people will spend an inordinate amount of time deciding where to go to college, it’s perhaps more important to figure out your major once you get there. That decision can have a life long impact of your ability to find a job once you graduate.

For example, in the graphic below which comes from the report you can see the recent majors with the lowest and highest overall unemployment rates. For example, Information System, Architecture and Anthropology degrees have the hardest time finding employment, while students getting a bachelors in Nursing, Elementary Education, and Parks and Recreation/Physical Fitness have the best chance of finding jobs right away.
Click to Enlarge
 Taking the analysis a step further, the report looks at employment prospects within majors by whether the graduate has any work experience as well as if they may have gotten a graduate degree. It's interesting to see how those with some sort of work experience in their chosen field fare so much better than those that don't.
Click to Enlarge
Of course this is all national level data. To provide a local perspective, below you will find two tables. The first provides a breakdown of the types of majors for people holding bachelors degrees in both Herkimer and Oneida Counties. The second shows the basic majors held by men versus women.

Click to Enlarge


Click to Enlarge

Tuesday, May 21, 2013

NYS DOL: Mohawk Valley Labor Market Profile (April 2013)

Information from the Department of Labor on the current employment, unemployment and market sectors for our region.


Monday, April 8, 2013

NYS DOL Labor Profile for the Mohawk Valley


The New York State Department of Labor recently released its Labor Profile for the Mohawk Valley. It provides a comparison between February and January of this year, as well as a comparison with February of 2013 and 2012 for the Utica-Rome MSA (Herkimer and Oneida Counties combined). It includes data on the number of people employed and unemployed, as well as some analysis by employment sector. 

For more information on employment you might consider contacting Mark Barbano, our Regional Economist for the Mohawk Valley with the State Department of Labor !

Click to Enlarge