Showing posts with label cost of living. Show all posts

Monday, March 14, 2016

A Look at a Cost of Living Assessment for Herkimer County


Getting a measure of the cost of living for an area is not an easy thing to do. No official numbers exist for small localities – typically cost of living data covers large, rather diverse, areas. For Herkimer County, as an example, the cost of living data collected by the Bureau of Economic Analysis is based on all of the rest of New York State, plus the New York City metro area that stretches from Connecticut to New Jersey.Using the cost of food, clothing, and shelter from those areas as part of our cost of living analysis makes local numbers very problematic.


Various services do offer different numbers based more on local data than the example listed above. Sperling’s Best Places to Live is one of these. They assess the total cost of living in an area by looking at groceries, healthcare, housing, utilities, transportation and miscellaneous costs. Each of these areas are defined as including the following:


  • Grocery  "The average cost of food in Grocery stores in an area." 
  • Health  "The average cost of health care calculated using the standard daily rate for a hospital room, and the costs of a doctor's office visit and a dental checkup."
  • Housing  "The average cost of an area's housing, which includes mortgage payments, apartment rents, and property tax."
  • Utilities  "The average cost of heating or cooling a typical residence for the area, including electricity and natural gas."
  • Transportation  "The average cost of gasoline, car insurance and maintenance expenses, and mass transit fare for the area. The cost of the vehicle and any vehicle registration and license taxes are not included."
  • Miscellaneous  "The cost index of those goods and services not included in the other cost of living categories, including clothing, restaurants, repairs, entertainment, and other services."


The total of all the cost of living categories are then weighted subjectively by Sperling’s as follows: housing (30%), food and groceries (15%), transportation (10%), utilities (6%), health care (7%), and miscellaneous expenses such as clothing, services, and entertainment (32%).  State and local taxes are not included in any category. 

For Herkimer County, the data compared to the US data subsequently looks like this:
 
CLICK TO ENLARGE
Note that the US data equals 100 in each index. 


So although for Herkimer County five of the six categories score higher than the US indices, (US always equals a score of 100) their impact is offset by the extremely low score for housing costs as seen by Sperlings for our area. As a result, the overall cost of living for Herkimer County is lower than that for the country as a whole (93 versus 100).

Monday, September 14, 2015

Living Wage Gaps By Counties

MIT’s Living Wage Calculator estimates the cost of living (“living wage”) in each of the nation's counties and major metropolitan areas, and compares it to the minimum wage for a variety of household types. Mapped here are three types: parent with spouse and two children, single parent with one child, and single adult.

Variations in the gap between living wage and minimum wage occur for a variety of reasons. A city with a relatively high minimum wage, for instance, may still show a large gap due to a high cost of living. Conversely, living expenses tend to be lower in rural areas, making even a relatively low minimum wage come closer to meeting basic household needs.

You can get Living Wage data for any county in the country from the link above. Below is the Herkimer County Data. Click to enlarge the table.

CLICK TO ENLARGE

 The MIT site also has a living wage map which includes similar data but allows you to see the data spatially. Below is the Herkimer County data and map. Go to their Living Wage Map to see the country, as well as New York State counties.

CLICK TO ENLARGE

Wednesday, August 27, 2014

The Relative Value of $100: A Countrywide, and Statewide, Comparative Look

The Tax Foundation recently recently released a map showing the relative value of $100 in each state of the US. Because average prices for similar goods are much higher in California or New York than in Mississippi or South Dakota, the same amount of dollars will buy you comparatively less in the high-price states, or comparatively more in low-price states. Using data from the Bureau of Economic Analysis they adjusted the value of $100 to reflect how prices are different in each state.

Click to Enlarge
 As you can see, $100 nationally is only worth about $86 worth of purchasing power in New York State.

They also did a similar map for the MSAs (think urban areas) in the country. Herkimer and Oneida Counties combined compose the Utica Rome MSA. The Utica Rome MSA actually has a purchasing power of $107.53 for that same $100 mentioned above. This would suggest that the cost of living is much lower here than for the rest of NY State.


Tuesday, August 12, 2014

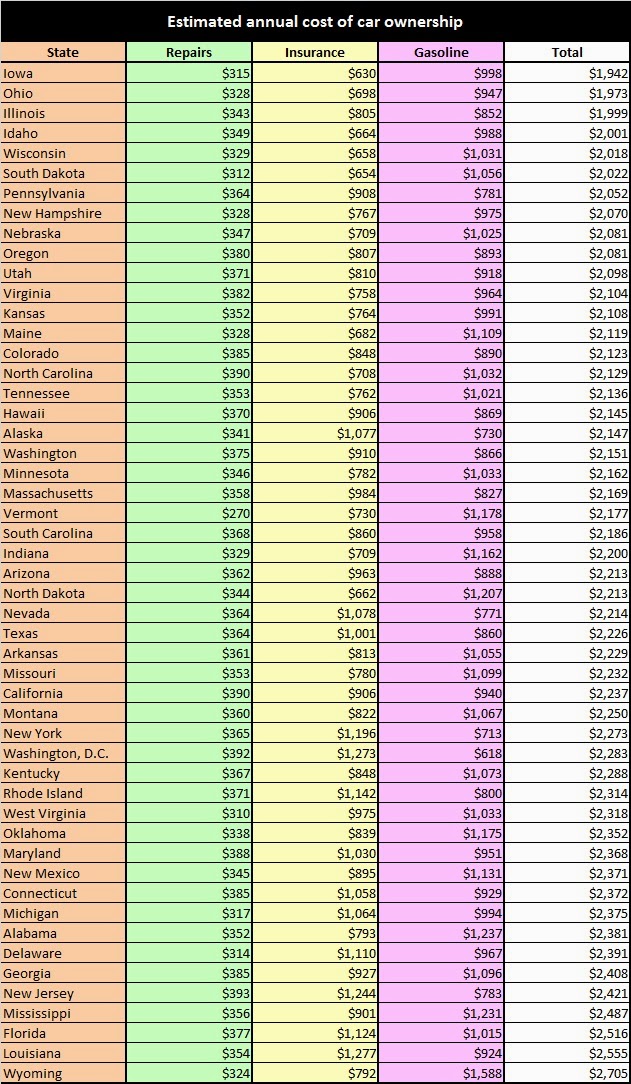
The LEAST and MOST Expensive States in Which to Own a Car

Bankrate analyzed the cost of gasoline, repairs and insurance in all 50 states and the District of Columbia. Three components were added together to get the total annual cost of owning a car - repairs costs, insurance costs, and totally annual gasoline expenditures. Labor and parts data were provided by CarMD.com, while gas spending was calculated with statistics from GasBuddy.com and the Bureau of Transportation Statistics. Insurance costs were compiled from National Association of Insurance Commissioners statistics.

Here's a state-by-state breakdown.


Friday, September 6, 2013

Living Conditions in the U.S: Hardships in Fulfilling Basic Needs

Roger Green, who runs the New York State Data Center Affiliates Blog notes that a recent report from the Census Bureau finds that 22 percent of households experienced one or more possible “hardships” in fulfilling their basic needs in the previous 12 months. These hardships included difficulty meeting essential expenses such as not paying rent or mortgage; getting evicted; not paying utilities; having utilities or phone service cut off; not seeing a doctor or dentist when needed; or not always having enough food. Among all households, 9 percent experienced exactly one of them, 7 percent experienced two of the hardships and 6 percent endured three or more of these problems.

These statistics come from Extended Measures of Well-Being: Living Conditions in the United States: 2011, a report based on the Survey of Income and Program Participation. The report measures well-being based on housing conditions, neighborhood conditions, community services, possession of specific types of appliances and electronic goods, the ability to meet basic needs and the expectation of help in meeting these needs ─ if necessary ─ from friends, family and the community. These measures are compared both across demographic groups and over time.

For example, the chart below shows the different hardships being faced by different age groups.

Click to Enlarge
What is interesting is how each group appears to place varying importance on different aspects of their lives. For example, among the youngest population (those 15 to 29 year old) the most common hardship they faced was unpaid utility bills. This was followed by not seeing a dentist when needed, and failing to pay their rent or mortgage. this is considerably different than the hardships facing the middle aged population (those 45 to 49 years old). Among middle aged Americans, the most common hardships faced were not seeing a dentist, not paying utilities, and not seeing a doctor when needed.

The report has many other insightful pieces and is well worth looking at. Unfortunately there is no locally comparative data.

Wednesday, April 10, 2013

Who's Minding the Kids? Child Care Arrangements and Costs


Parents in the labor force face numerous decisions when balancing their work and home life, including choosing the type of care to provide for their children while they work. Deciding which child care arrangement to use has become an increasingly important family issue as maternal employment has become the norm, rather than the exception. Child care arrangements and their costs are significant issues for parents, relatives, care providers, policy makers, and anyone concerned about children.

The Census Bureau has released a report entitled Who's Minding the Kids? Child Care Arrangments: Spring 2011 which is the latest in a series that dates back to 1985. This report describes the number and characteristics of children in different types of child care arrangements in the spring of 2011. Included in the report are references to the living arrangements, care provider characteristics, and the costs associated with providing care to our children.

While the report looks only at national data, there are reimbursement guidelines for Departments of Social Service to follow issued by the NYS Office of Children and Family Services. These reimbursement guidelines are established for  five different groups of counties, of which Herkimer and Oneida Counties fall under Group 3. Group 3 includes:Allegany, Broome, Cattaraugus, Cayuga, Chautauqua, Chemung, Chenango, Clinton, Cortland, Delaware, Essex, Franklin, Fulton, Genesee, Greene, Hamilton, Herkimer, Jefferson, Lewis, Livingston,  Madison, Montgomery, Niagara, Oneida, Orleans, Oswego, Otsego,  Schoharie, Schuyler, Seneca, St. Lawrence, Steuben, Sullivan, Tioga, Washington, Wayne, Wyoming, and Yates counties.

Reimbursement rates are based on a combination of factors, including the type of provider, the age of the child, the duration of care, and if the child has any special needs. To read the guidelines, and see what the maximum reimbursement rates are for our region you can read the you can find the full document here, or you can click on the two pages below to see the maximum reimbursements guidelines for Group 3 counties for the years 2011 through 2013.


Click to Enlarge

Click to Enlarge

Thursday, April 5, 2012

Cost of Living Data For Herkimer and Oneida Counties to Improve

The Herkimer Oneida Counties Comprehensive Planning Program (HOCCPP) has recently joined with the Council for Community and Economic Research (C2ER) to begin collecting data to be used to establish a local cost of living index, or COLI. Years ago HOCCPP participated in such an endeavor when it was run under the auspices of the American Chamber of Commerce Research Association (ACCRA).

While cost-of-living data is available through the Bureau of Economic Analysis (BEA), this data is not particularly relevant to most of upstate New York. The basis for the BEA cost-of-living data is a rather large geographic area that does include upstate New York. But it also includes all of New York City, Long Island, Connecticut, and most of New Jersey. It's easy to understand then how the living standards it measures in the greater New York metro area have little in common with the standards in the far more rural areas upstate.

The C2ER COLI is based on local market prices. For our region it would include stores and purchases made within Herkimer and Oneida Counties. This allows for far better comparisons with other metro areas such as Syracuse, Albany, Rochester and Buffalo. Since each area's COLI is based on it's own local prices, the index becomes more meaningful for planning and promotional purposes.

C2ER helps regions that participate gather data on a variety of items to create the cost-of-living index. These include groceries, housing, transportation, health care, clothing and other miscellaneous items. To see a complete list of what items are priced as part of the COLI, take a look at their price survey.